DRX
General Questions
For biophysical experiments, a switchSENSE® measurement combines two aspects:
- A fluorescence measurement, where the fluorophore emission intensity is subject to two influences:
- a non-radiative energy transfer to the metal electrode, which depends on the distance between the fluorophore and the metal surface
- quenching or enhancement of the fluorescence intensity of the dye due to the proximity between the dye and molecules bound within its probing environment.
- The electrical control over the orientation of end-tethered DNA nanolevers:
- either by applying a constant potential (mild negative potentials) to the electrode to align the DNA in a fixed, well-defined orientation (usually upright).
- or by applying alternating repulsive and attractive potentials to facilitate a dynamic oscillation of the DNA nanolever orientation.
This implies that a switchSENSE® experiment can be performed using two different approaches: with switching of the DNA nanolevers (dynamic mode) or without switching (static mode). These two measurement modes differ mainly in the electric potentials that are applied to the sensor electrodes. Experiments in dynamic mode are performed under constant orientation switching of the DNA nanolevers, actuated by oscillating potentials, which either attract or repel the DNA backbones.
In contrast to this, experiments in static mode are performed with a constant potential (usually negative) that keeps the DNA nanolevers static at a fixed angle. Figure 2 illustrates the two measurements modes.
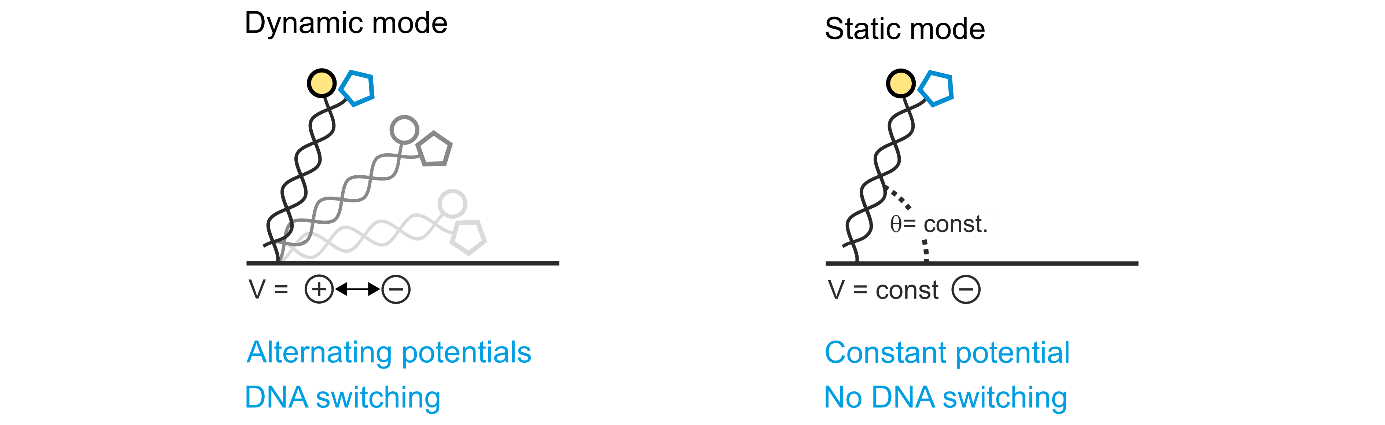
Figure 2: switchSENSE® measurement modes. In dynamic mode, the potentials applied to the sensor electrodes are alternated, which drives the DNA nanolevers to oscillate on the electrode’s surface due to their negatively charged backbone. When using the static mode, usually a constant negative potential is applied, which positions the DNA nanolevers constantly in an upright conformation.
Experiments in dynamic mode provide the following evaluation parameters:
- Molecular dynamics: hydrodynamic changes can be detected as changes in the Dynamic Response.
- Protein sizing: the hydrodynamic diameter (DH) of proteins, protein complexes or of folded nucleic acids can be determined using the Lollipop model.
- Fluorescence proximity sensing (FPS): changes in the local environment of the fluorophore are detected from the changes in the intensity of the fluorescence emission.
- Molecular ruler: changes in the average position of the fluorophore with respect to the gold surface can be determined by observation of the fluorescence intensity.
When to use best:
- When working at salt concentrations up to physiological conditions.
- Experiments with small ligand molecule relative to a larger analyte molecule provide best signal to noise ratio in molecular dynamics.
Advantages compared to static mode:
- Full experimental information content is provided
- Excellent long-term signal stability during kinetic experiments
Experiments in static mode provide the following evaluation parameters:
- Fluorescence proximity sensing (FPS): changes in the local environment of the fluorophore are detected by changes in the intensity of the fluorescence emission.
- Molecular ruler: changes in the average position of the fluorophore with respect to the gold surface can be determined by observation of the fluorescence intensity.
Advantages compared to dynamic mode:
- Improved signal to noise ratio and higher sensitivity for FPS analysis
- Extended chip lifetime
switchSENSE® is a biophysical research technology to investigate molecular interactions. The core of this technology are DNA nanolevers attached to gold microelectrodes. These DNA nanolevers can easily be customized with any ligand of choice. The orientation of the nanolevers can be controlled by applying voltage to the microelectrodes. We differentiate two measurement modes in switchSENSE® experiments, the dynamic mode and the static mode. In dynamic mode, an alternating voltage is applied, causing the negatively charged DNA nanolevers to oscillate at high frequencies. In static mode, a negative voltage is applied to hold the nanolevers in a static, upright orientation. The nanolevers are additionally equipped with a fluorescent dye. The readout signal of a switchSENSE® experiment is a change in fluorescence intensity. This can be caused by multiple events. For example, the local environment of the dye can change due to e.g. binding of an analyte to the ligand. Furthermore, the gold electrode surface quenches the dye, thus changes in the distance between the dye and the sensor surface will affect the fluorescence intensity. Some assays also include a second fluorescent dye and changes in intensity are caused by Förster resonance energy transfer (FRET) between the two dyes (see Which options do I have for dual-color assays? for details). Based on these measurement modes you can characterize your molecular interactions in great detail, ranging from kinetic rates to conformational changes of binding partners. Find out more about the technical details of switchSENSE® here.
Molecular Dynamics
Hydrodynamic changes can be detected as changes in the Dynamic Response. Generally, events that increase the hydrodynamic friction, such as binding of an analyte molecule to the ligand, result in a slower switching motion, which can be observed as a decrease of the Dynamic Response. On the contrary, events that reduce the hydrodynamic friction, for example during conformational changes, cause the DNA nanolevers to switch faster, which can be observed as an increase in Dynamic Response.
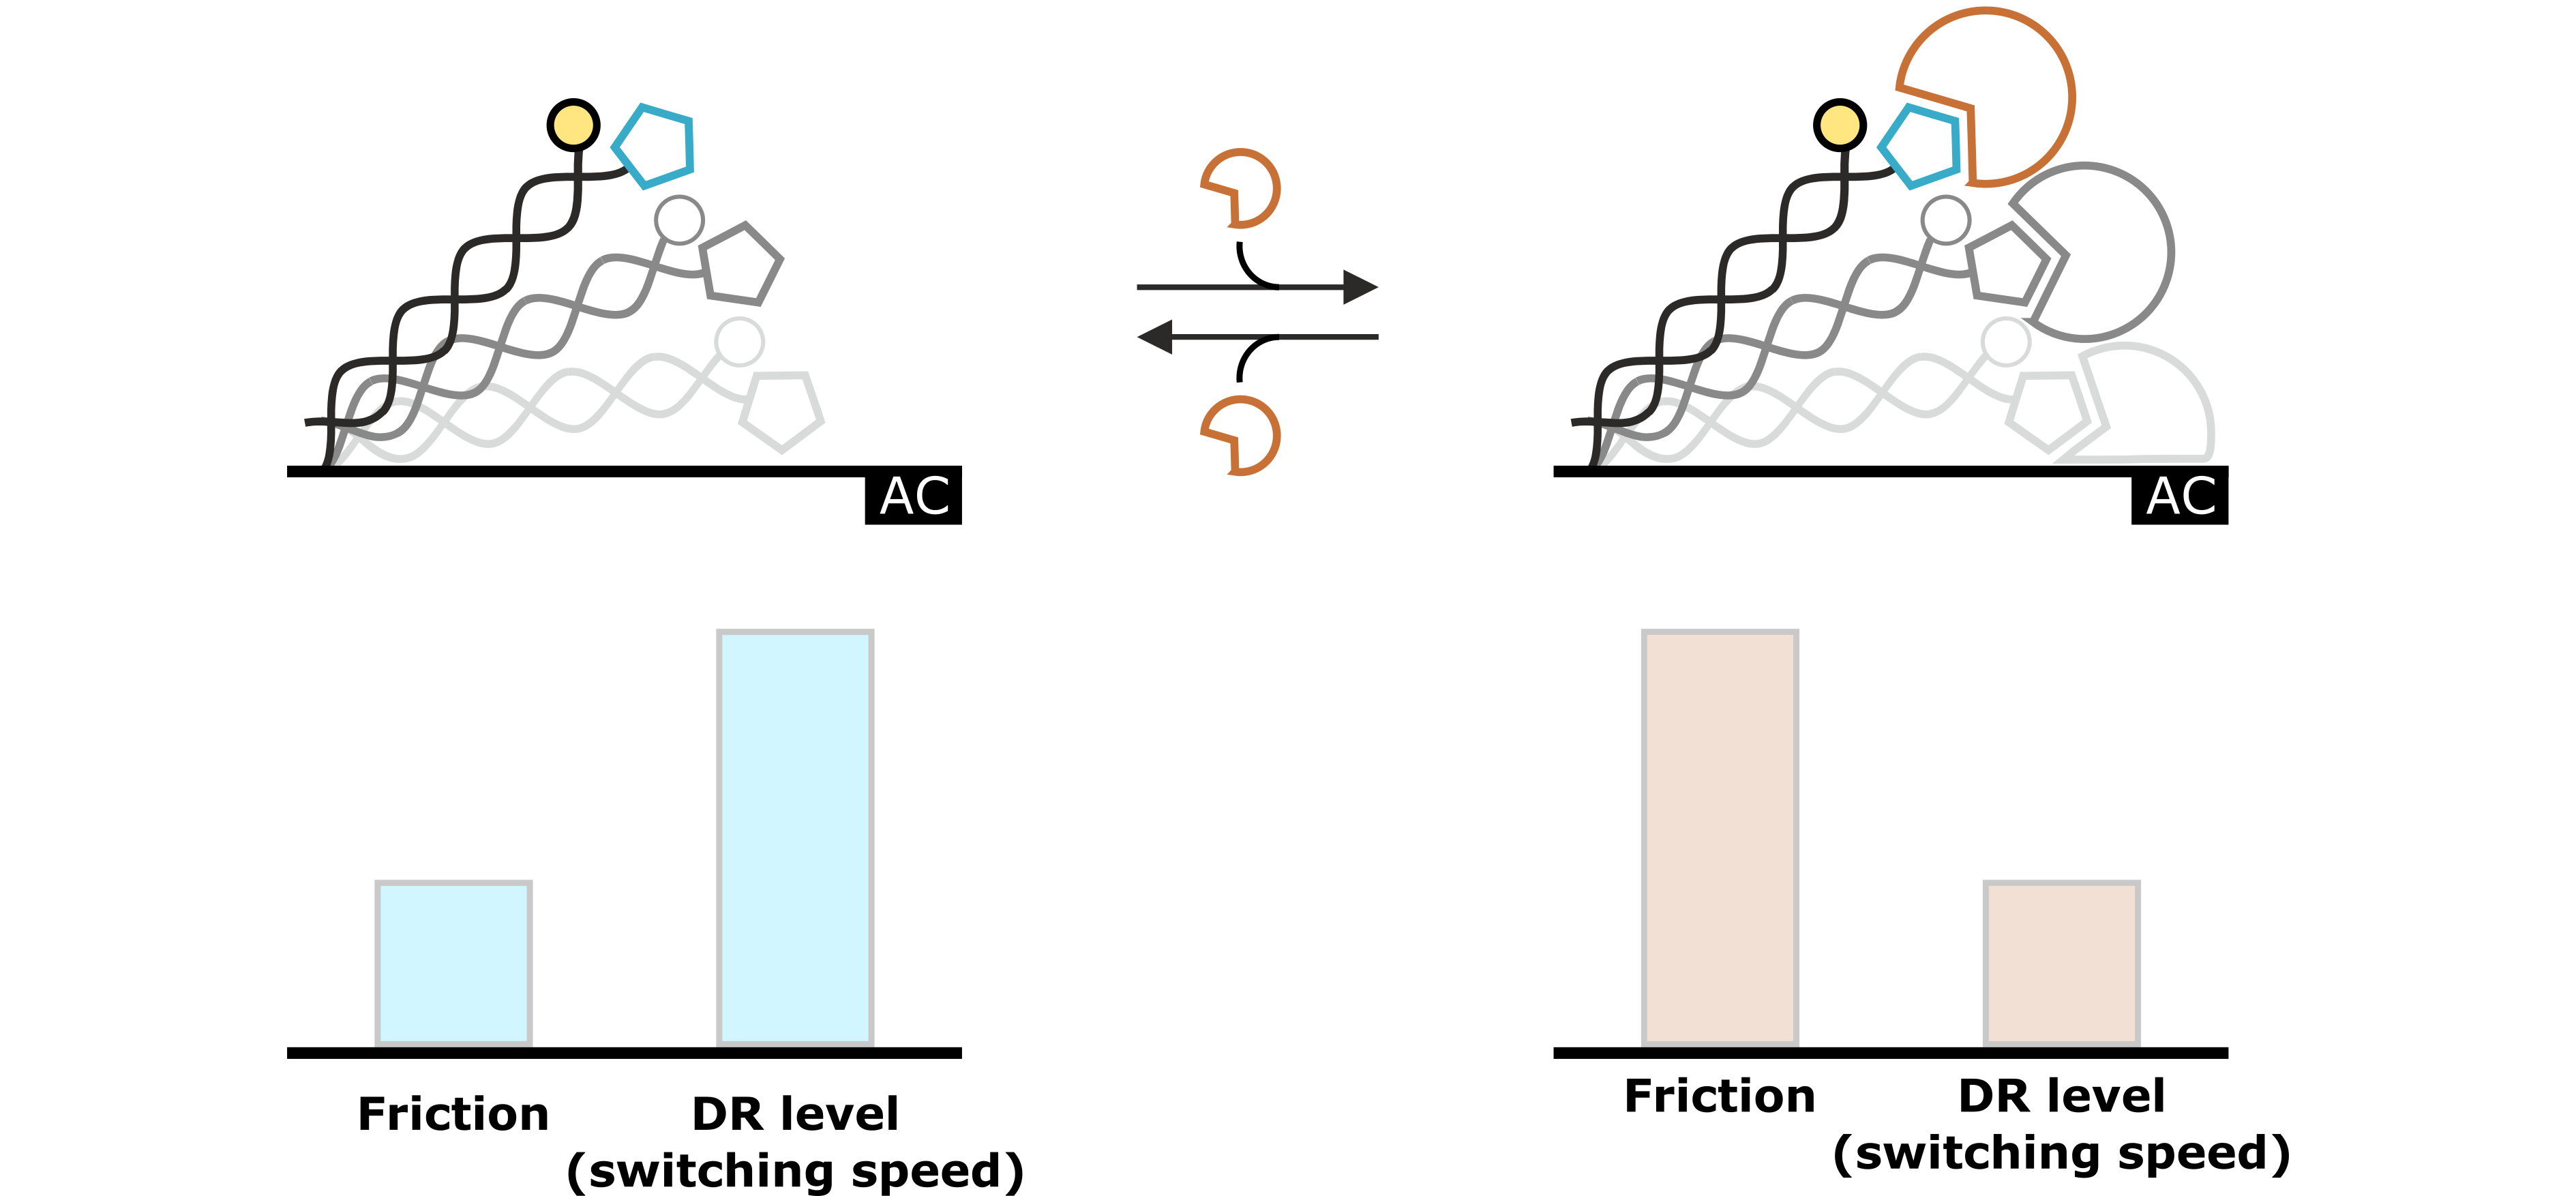
Figure 3: The molecular dynamics of the DNA switching process reflect the hydrodynamic drag, which is exerted on the DNA nanolevers. This specific hydrodynamic drag is characterized by the nanolever’s switching speed, which can be quantified by the Dynamic Response (DR) level. Changes that affect the hydrodynamic conditions (e.g. analyte association) are reflected in changes of the DR value.
Protein Sizing
The size of a molecule can be described using the hydrodynamic diameter (DH), which corresponds to the diameter of a perfect sphere with the same hydrodynamic friction coefficient as the molecule of interest. DH of proteins or protein complexes can be determined using a mathematical model to describe the hydrodynamics of the switching motion of the DNA nanolevers. This so-called Lollipop Model treats the DNA nanolevers as charged and rigid cylinders that carry a spherical molecule at the distal end (Figure 4). Solutions to this model provide the hydrodynamic diameter of the attached molecule in nanometers.

Figure 4: The lollipop model mathematically simplifies the hydrodynamic properties of DNA nanolevers with attached protein molecules by assuming that the DNA is a charged and rigid cylinder that carries a spherical body on top. Solutions of the lollipop model provide the hydrodynamic diameter of the attached protein in nanometers.
Fluorescence Proximity Sensing (FPS)
FPS changes in the local environment of the fluorophore are detected by changes in the intensity of the fluorescence emission. The fluorescence emission can either be enhanced or decreased, for instance by changes in the local hydrophobicity.
A typical application of FPS is the real-time detection of the association of an analyte to an immobilized ligand molecule. Figure 5 shows an example of how binding of an analyte can be observed as a quenching effect of the fluorophore. Due to the permanent Brownian motion of the fluorescent dye, it constantly probes its local environment, which results in a specific fluorescence emission. Once the local environment of the dye is changed resulting from association of the analyte, the fluorophore probes an altered molecular surface, thus sensing the presence of the analyte molecule. This results in the presented example in a decreased fluorescence emission.
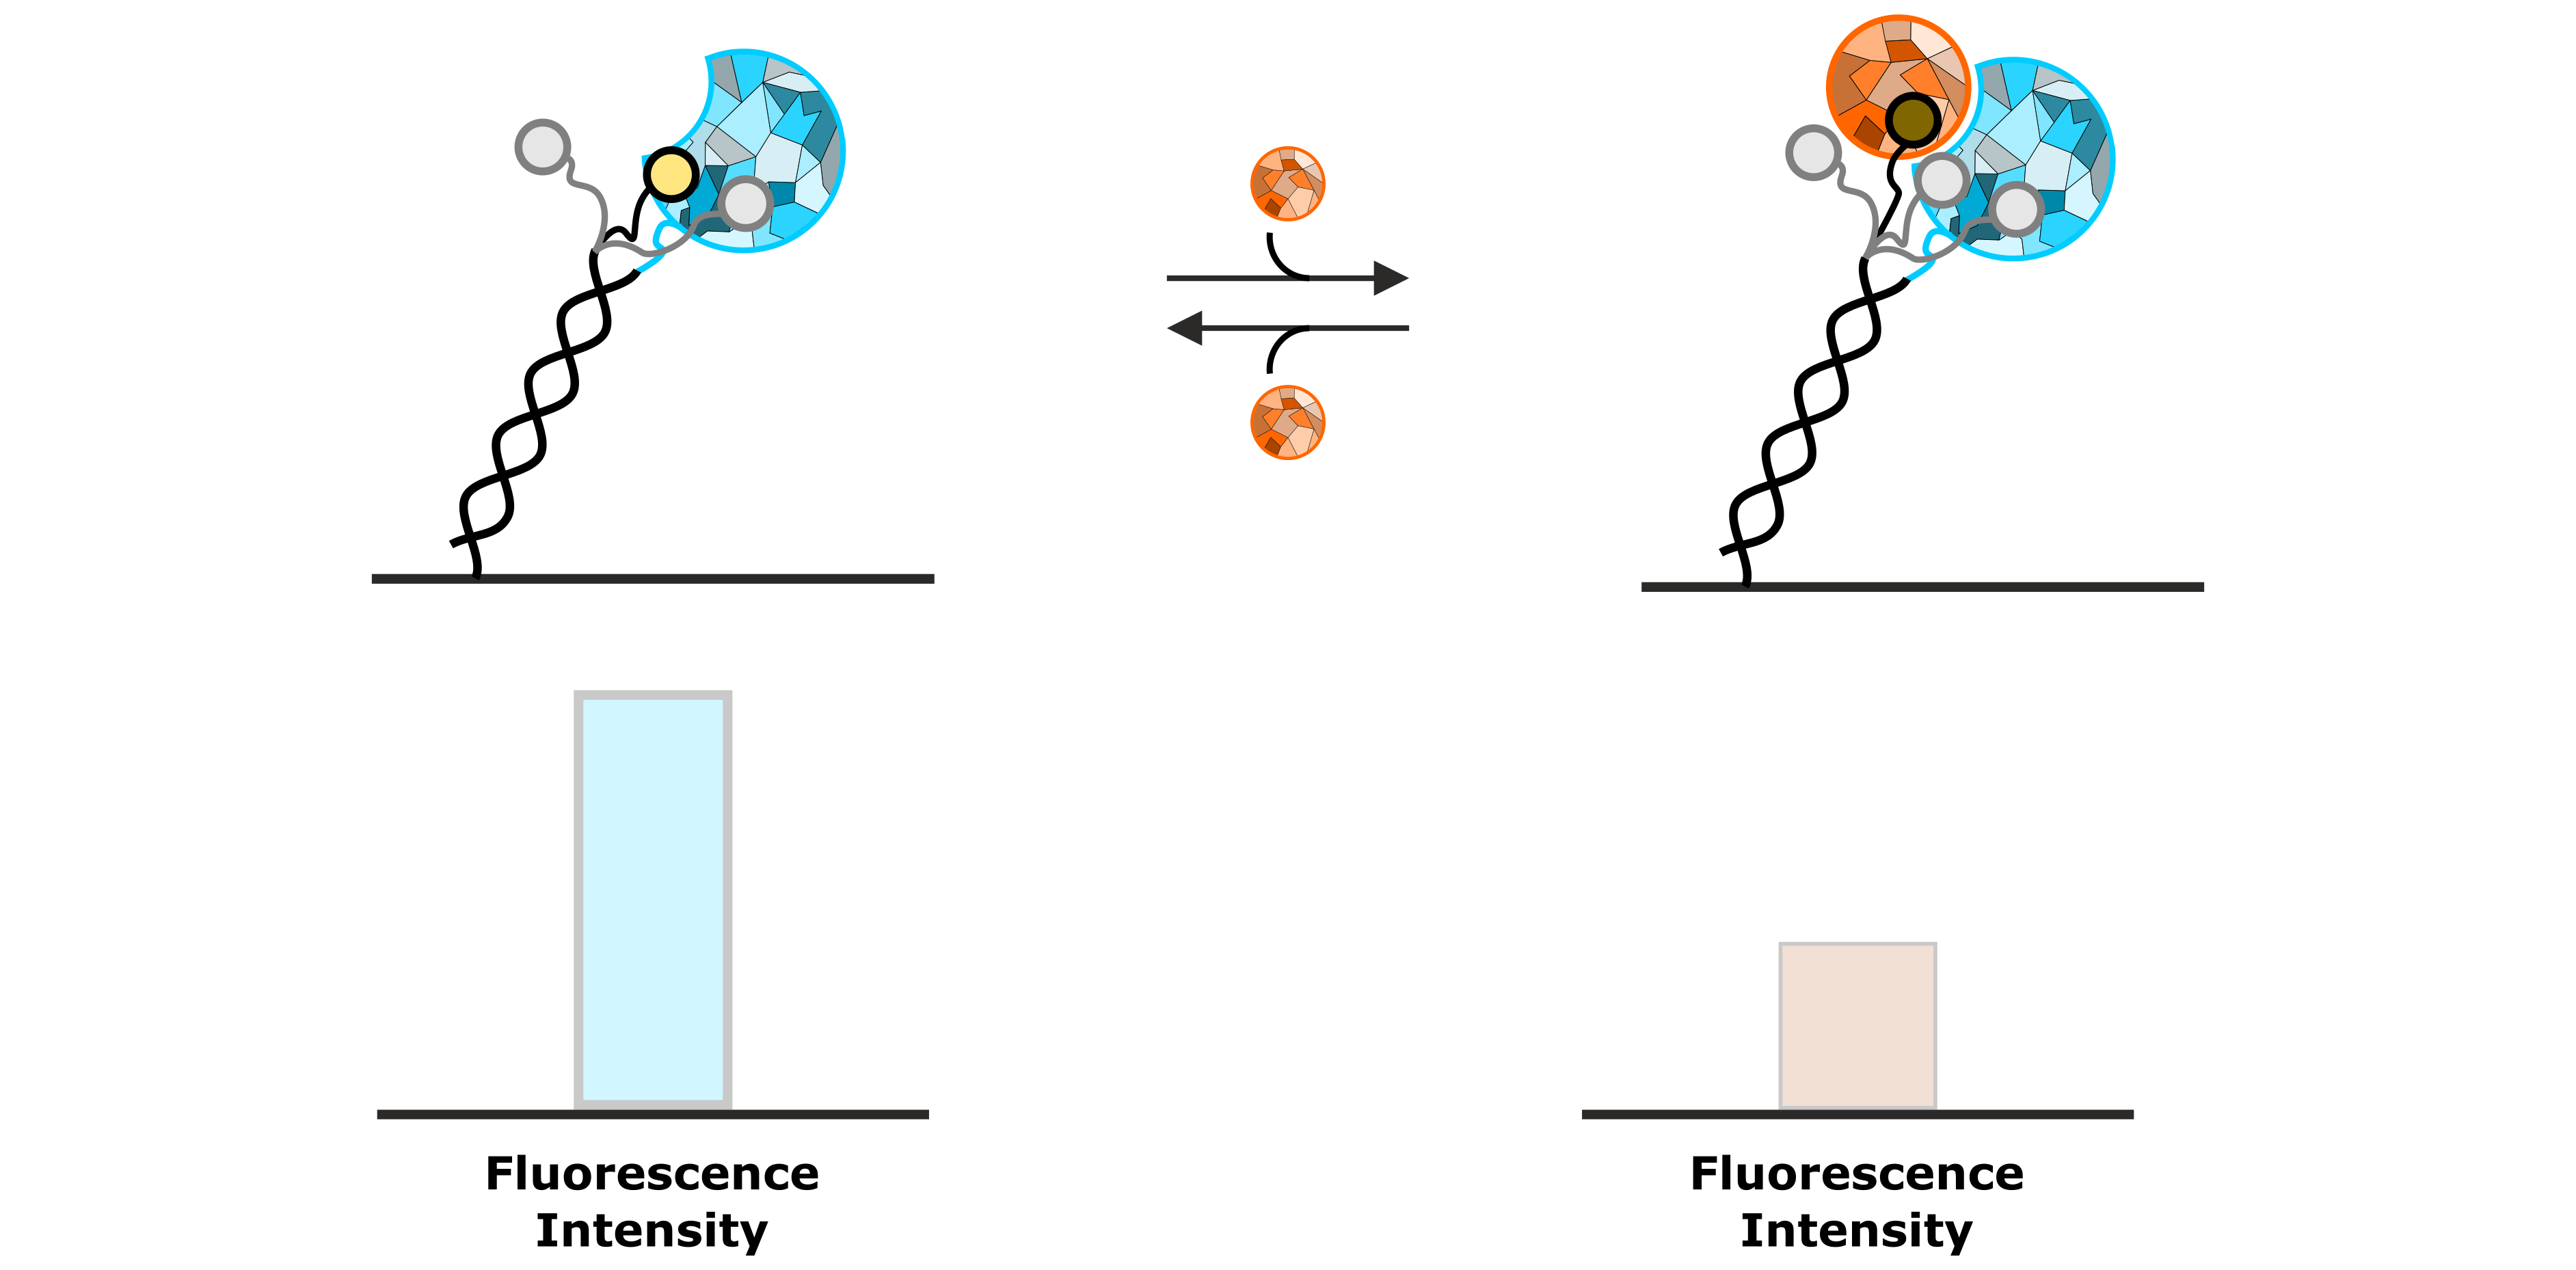
Figure 5: Permanent sensing of its local environment causes the fluorescent dye to emit a specific intensity of fluorescent light. The association of an analyte molecule influences the local environment, resulting in a decrease of fluorescence emission.
An example, in which the fluorescence intensity is increased upon association of an analyte molecule, is shown in Figure 6. In this case, the fluorophore possesses a certain affinity to the immobilized ligand molecule, for instance to a hydrophobic enzymatic cleft of the test protein. While the fluorophore is bound to the immobilized protein, the fluorescence emission is quenched. The interaction with a specific analyte molecule interrupts the weak interaction between fluorophore and protein by displacing the dye. The released fluorophore can now move freely and is not quenched anymore, which can be observed as an increased intensity of the fluorescent light.
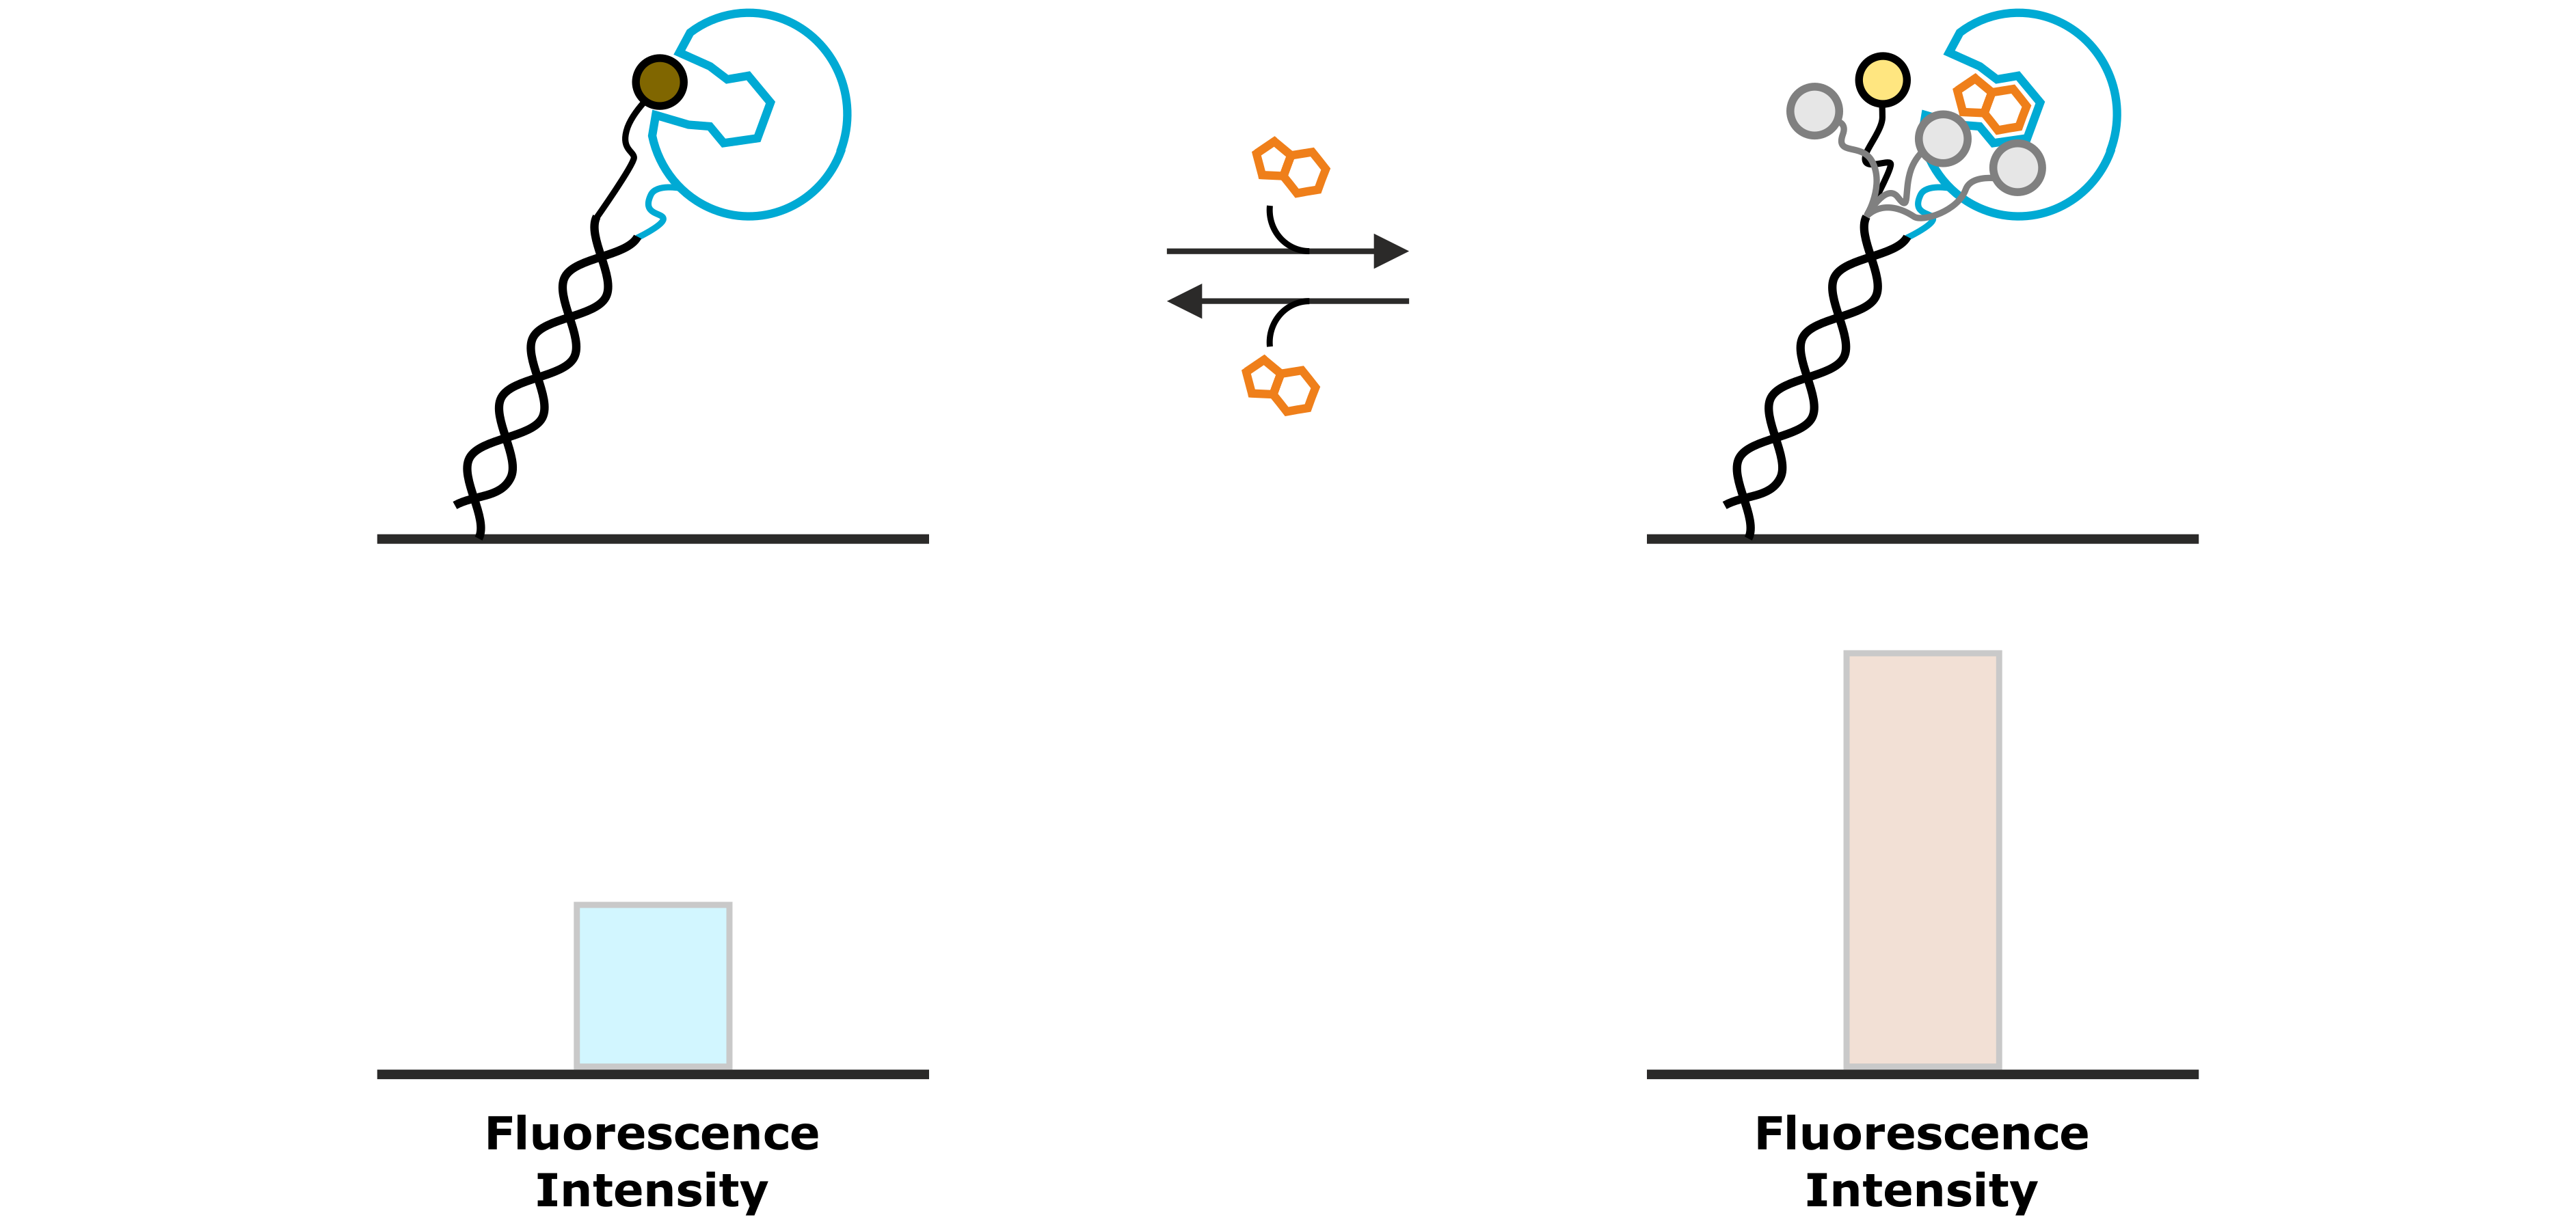
Figure 6: A weak interaction between the fluorescent dye and the immobilized ligand molecule results in a low base-line fluorescence intensity, due to the quenching of the fluorophore. A specifically binding analyte competes with the fluorophore and displaces it from the protein, thus enhancing its fluorescence intensity.
Molecular Ruler
The second analysis signal that utilizes the absolute fluorescence intensity of the fluorophore as read out, is the Molecular Ruler analysis. While FPS detects changes in the local environment of the fluorescent dye, effects that can be detected from a Molecular Ruler signal, affect the average distance of the fluorophore to the gold surface and thus the degree of fluorescence quenching. Examples of such processes are association of DNA-binding proteins that change the DNA conformation (e.g. by bending; Figure 7) or enzymatic DNA elongation by polymerases. Figure 8 explains the Molecular Ruler principle using the example of a polymerase driven DNA elongation.
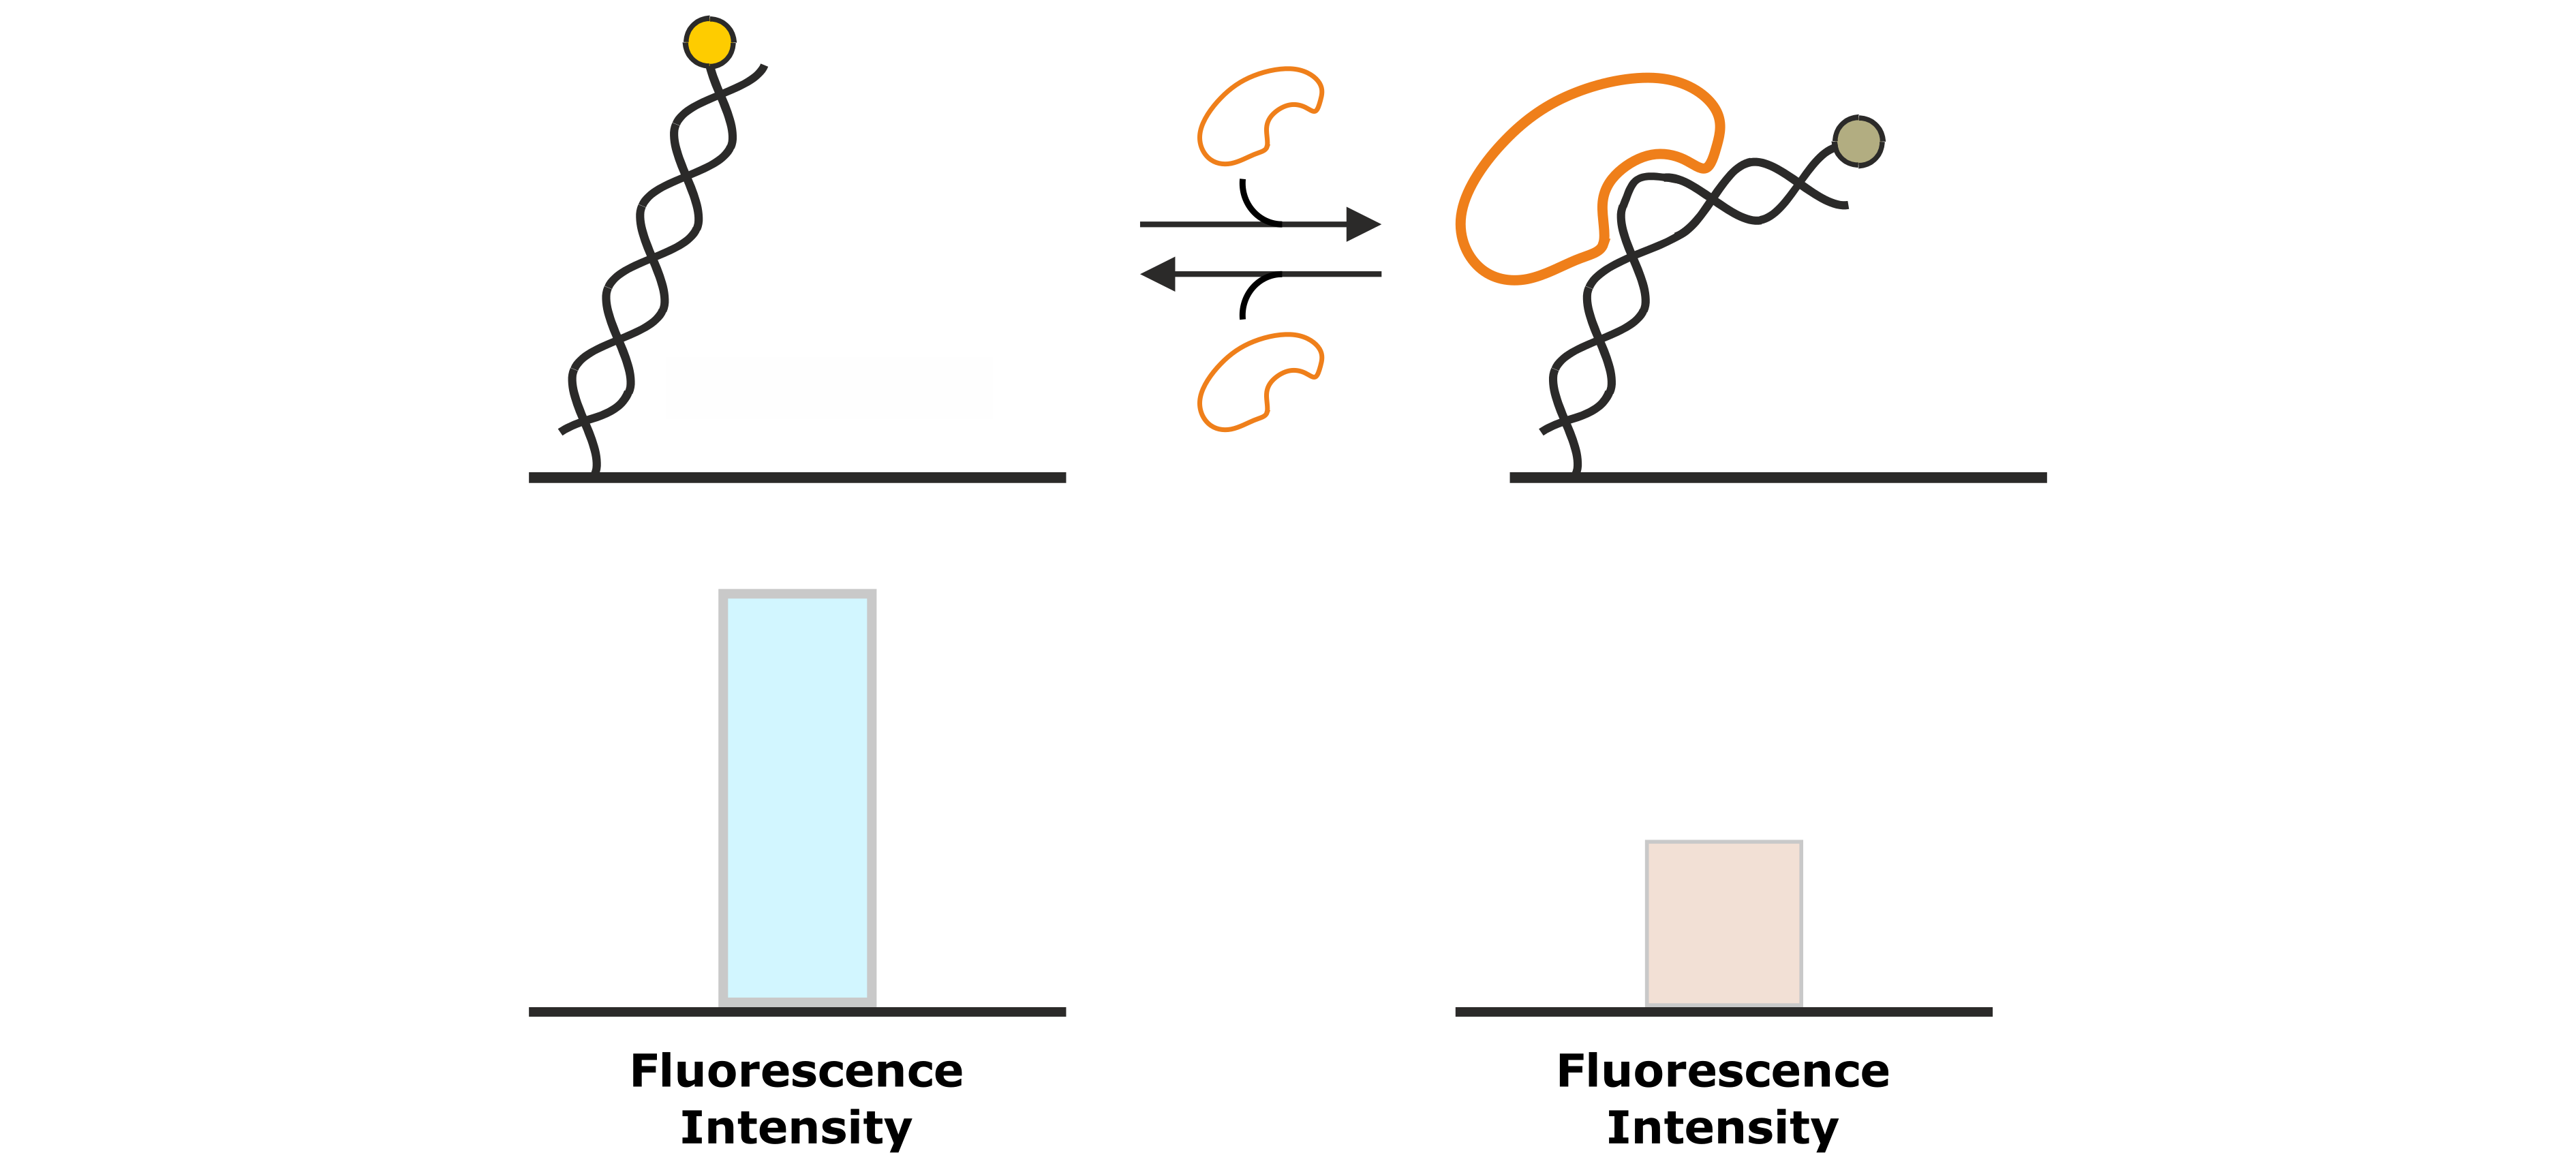
Figure 7: DNA binding proteins that associate to the DNA backbone often cause a conformational change of the DNA by bending of the double helix. This changes the position of the fluorescent dye at the distal end of the DNA nanolever, which is associated by a change in fluorescence intensity.
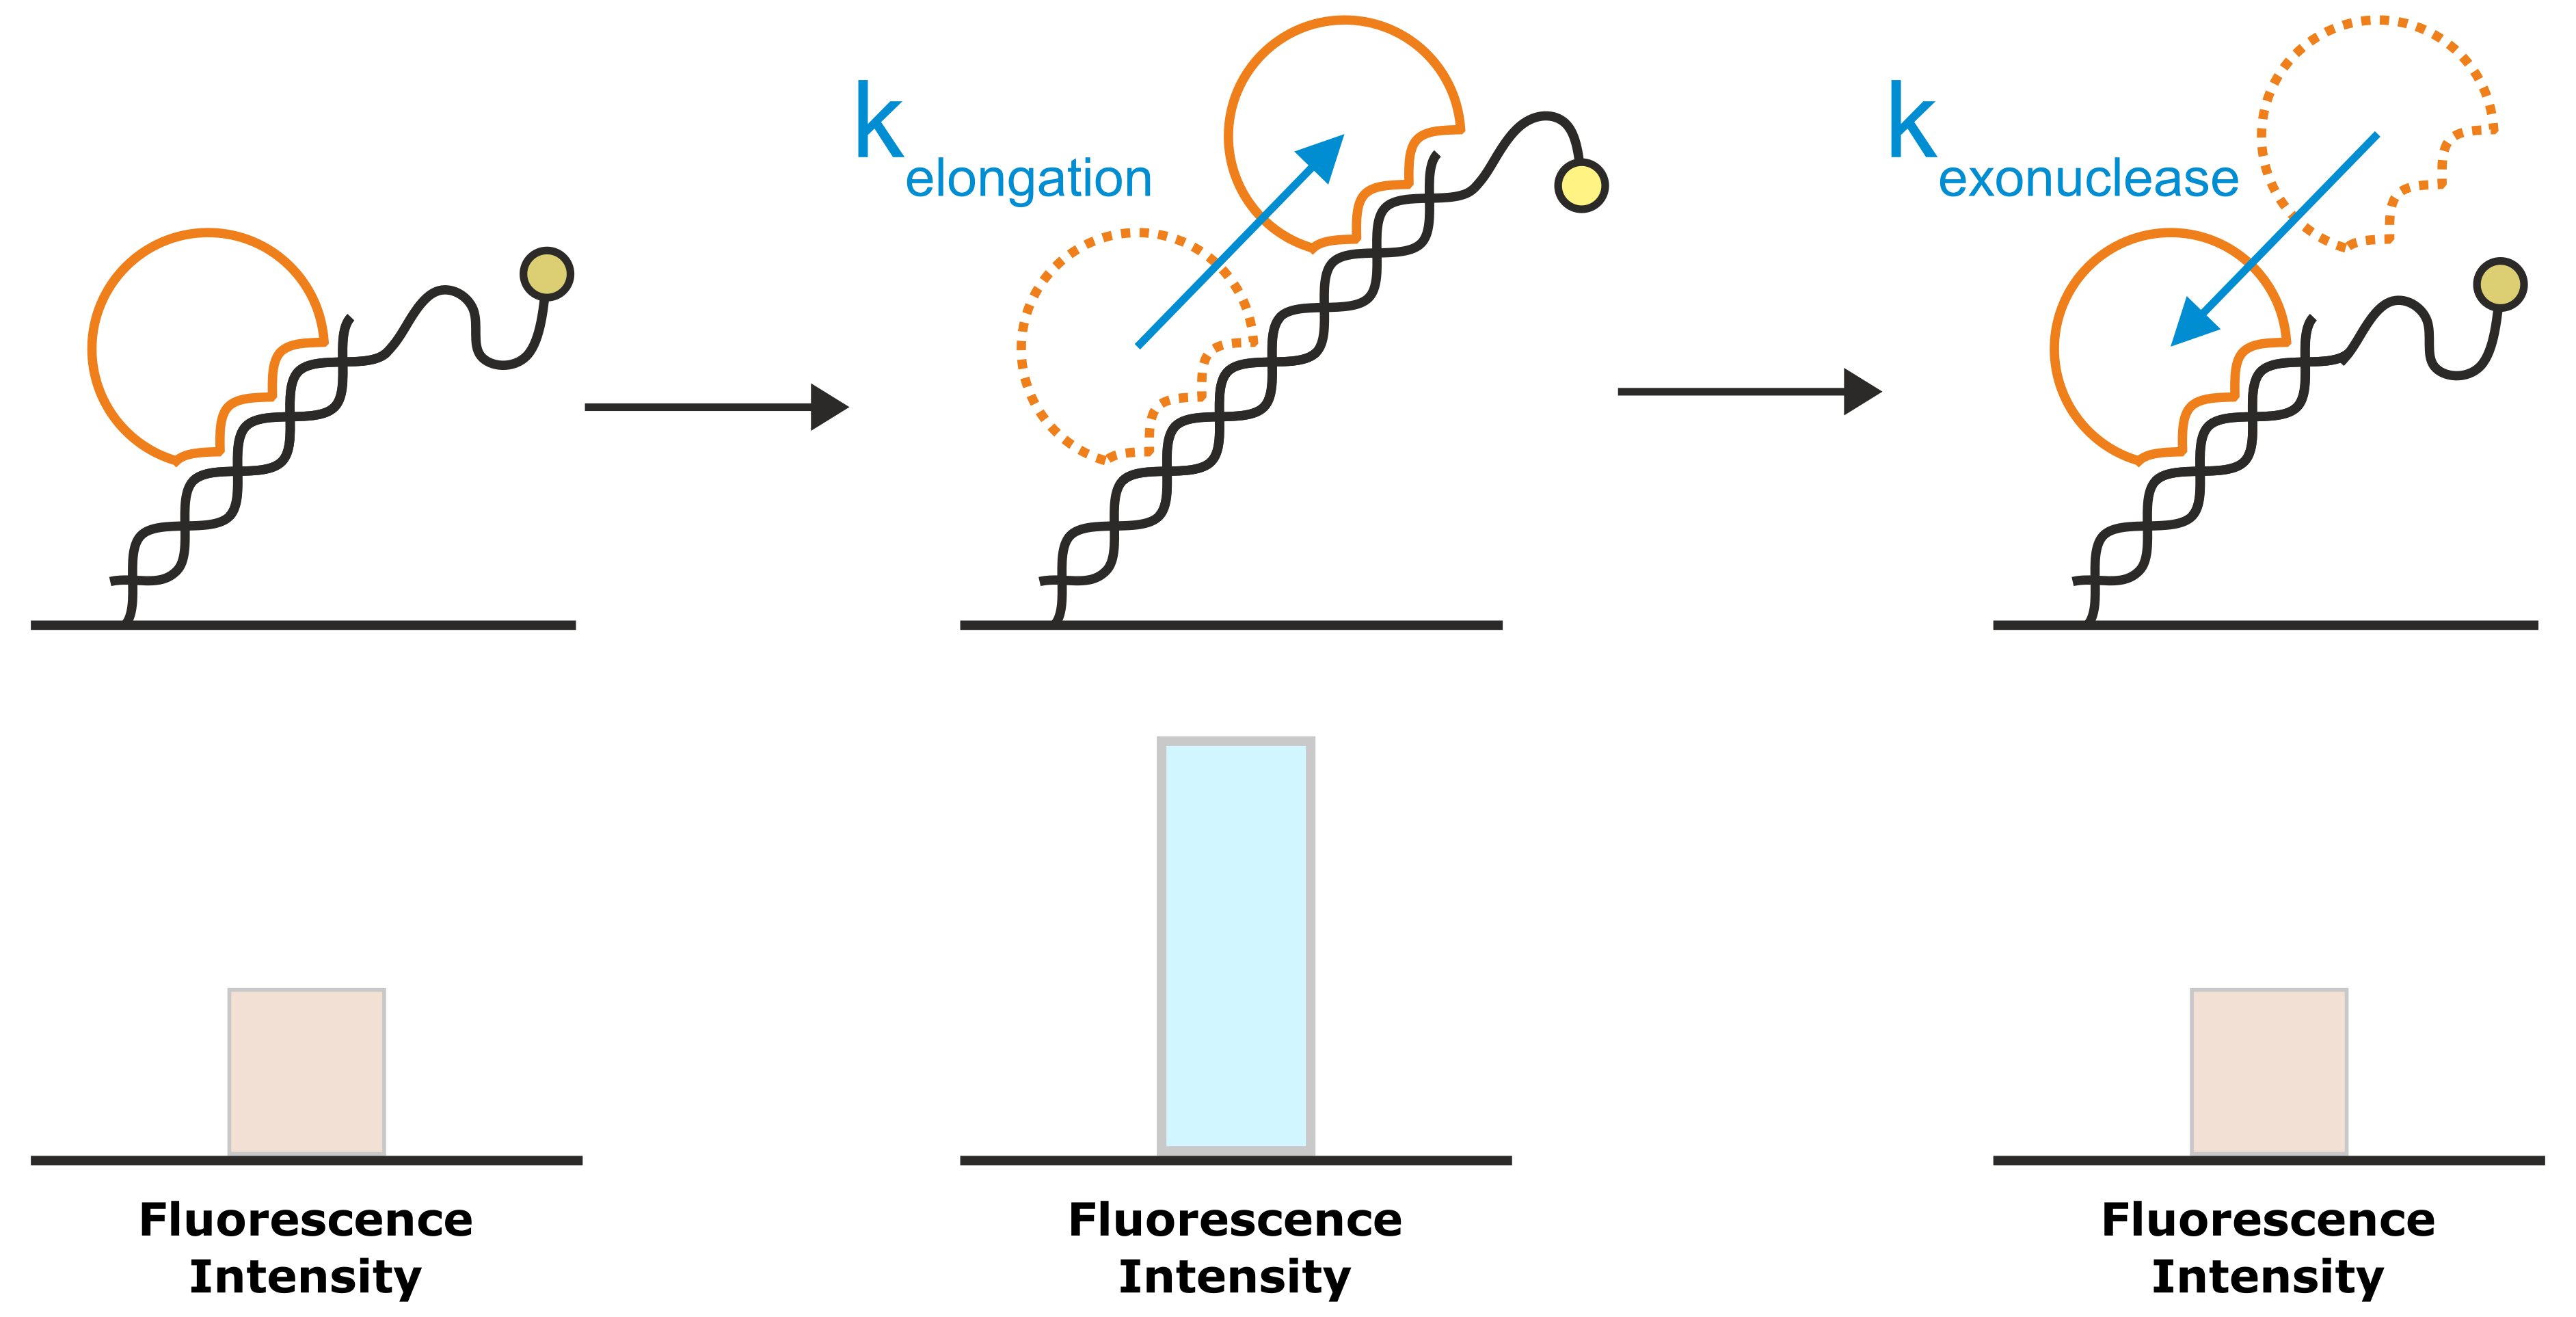
Figure 8: A very common application of the Molecular Ruler principle is the investigation of DNA elongation kinetics by polymerases. The template for the DNA elongation is a double-stranded DNA nanolever that is modified with a single-stranded overhang. In the initial state, the partly single-stranded nanolevers exhibit a relatively low fluorescence intensity, owing to their high flexibility that allows them to approach the quenching gold surface. Once a polymerase starts to elongate the DNA, the single-stranded DNA overhang is converted into a rigid double-helix. The transition from the flexible single-strand DNA into the rigid double-strand moves the average position of the fluorophore further away from the gold surface, which results in an enhanced fluorescence intensity. For enzymes with exonuclease activity, the reverse approach yields a decrease in fluorescence intensity.
Please see section “What are the signals that can be derived from switchSENSE® experiments?”.
The Lollipop model is a biophysical model used in DRX instruments to provide an estimated size of the protein of interest in form of the hydrodynamic diameter. The model assumes that the DNA nanolevers are a charged and rigid cylinder and the attached protein molecules are a spherical body on top of the cylinder. Data obtained in a dynamic mode measurement are compared with a library of simulated data. A detailed mathematical description is published and can be found here. The application of the lollipop model for protein sizing is limited since it highly depends on e.g. the buffer and the nanolever size. That is why we do not apply it in our new heliX® product line.
The hydrodynamic diameter (Dh) of a molecule is defined as the diameter of a perfect solid sphere that would exhibit the same hydrodynamic friction as the molecule of interest. Thus, the Dh value reflects primarily the hydrodynamic friction but is usually also a good estimation of the absolute size of the molecule. Generally, the more globular the shape of a molecule is, the better the Dh value reflects the actual diameter.
The Dynamic Response (DR) is a parameter that characterizes the switching speed of DNA nanolevers. It is automatically calculated from the raw data by the switchSENSE® software package. For every recorded data point, the software evaluates typically the upward motion of the DNA nanolevers as indicated in Figure 9. Integration of the normalized time-resolved fluorescence intensity traces that reflect the upward motion, yields the Dynamic Response value for a certain time interval. Changes of the hydrodynamic friction, such as the interaction with an analyte molecule, will affect the progression of the fluorescence intensity curve, reflecting the altered switching dynamics. As indicated in Figure 9, such an event will yield a different integrated area (=DR) under the fluorescence intensity curve, compared to the initial state. Generally, small DR values can be attributed to slow switching motion and large values indicate fast switching.
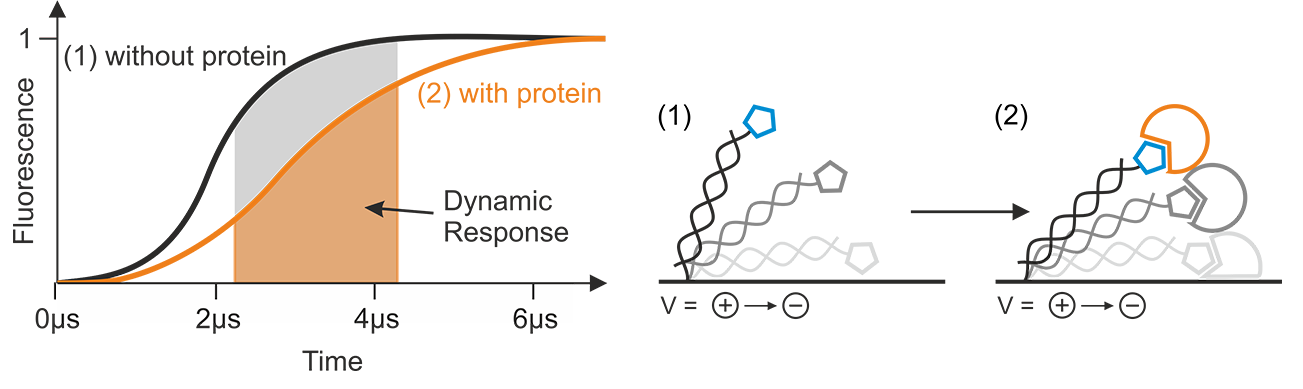
Figure 9: The Dynamic Response is calculated by integration from normalized fluorescence intensity data, typically of the upward motion of the DNA nanolevers. Events, such as the binding of an analyte, which change the hydrodynamic friction, affect the steepness and shape of the normalized fluorescence intensity progression, resulting in a different Dynamic Response level.
Depending on the interaction to be investigated, it is advisable to select different integration time intervals for optimal signal to noise ratio. Hence, the Dynamic Response is provided for several integration intervals. For the respective interval, the time at which the potential is reversed from an attractive (positive) to a repulsive (negative) potential, is defined as 0 .
Additional parameter of the Dynamic Response is the Dynamic Response downward (DRdown), which is used to characterize the downward motion of the DNA nanolevers. Corresponding to the upward motion of the DNA nanolevers, also their downward motion is affected by changes in the hydrodynamic drag resulting in high DR levels for fast switching, and low levels for slow switching.