Molecular Dynamics
Hydrodynamic changes can be detected as changes in the Dynamic Response. Generally, events that increase the hydrodynamic friction, such as binding of an analyte molecule to the ligand, result in a slower switching motion, which can be observed as a decrease of the Dynamic Response. On the contrary, events that reduce the hydrodynamic friction, for example during conformational changes, cause the DNA nanolevers to switch faster, which can be observed as an increase in Dynamic Response.
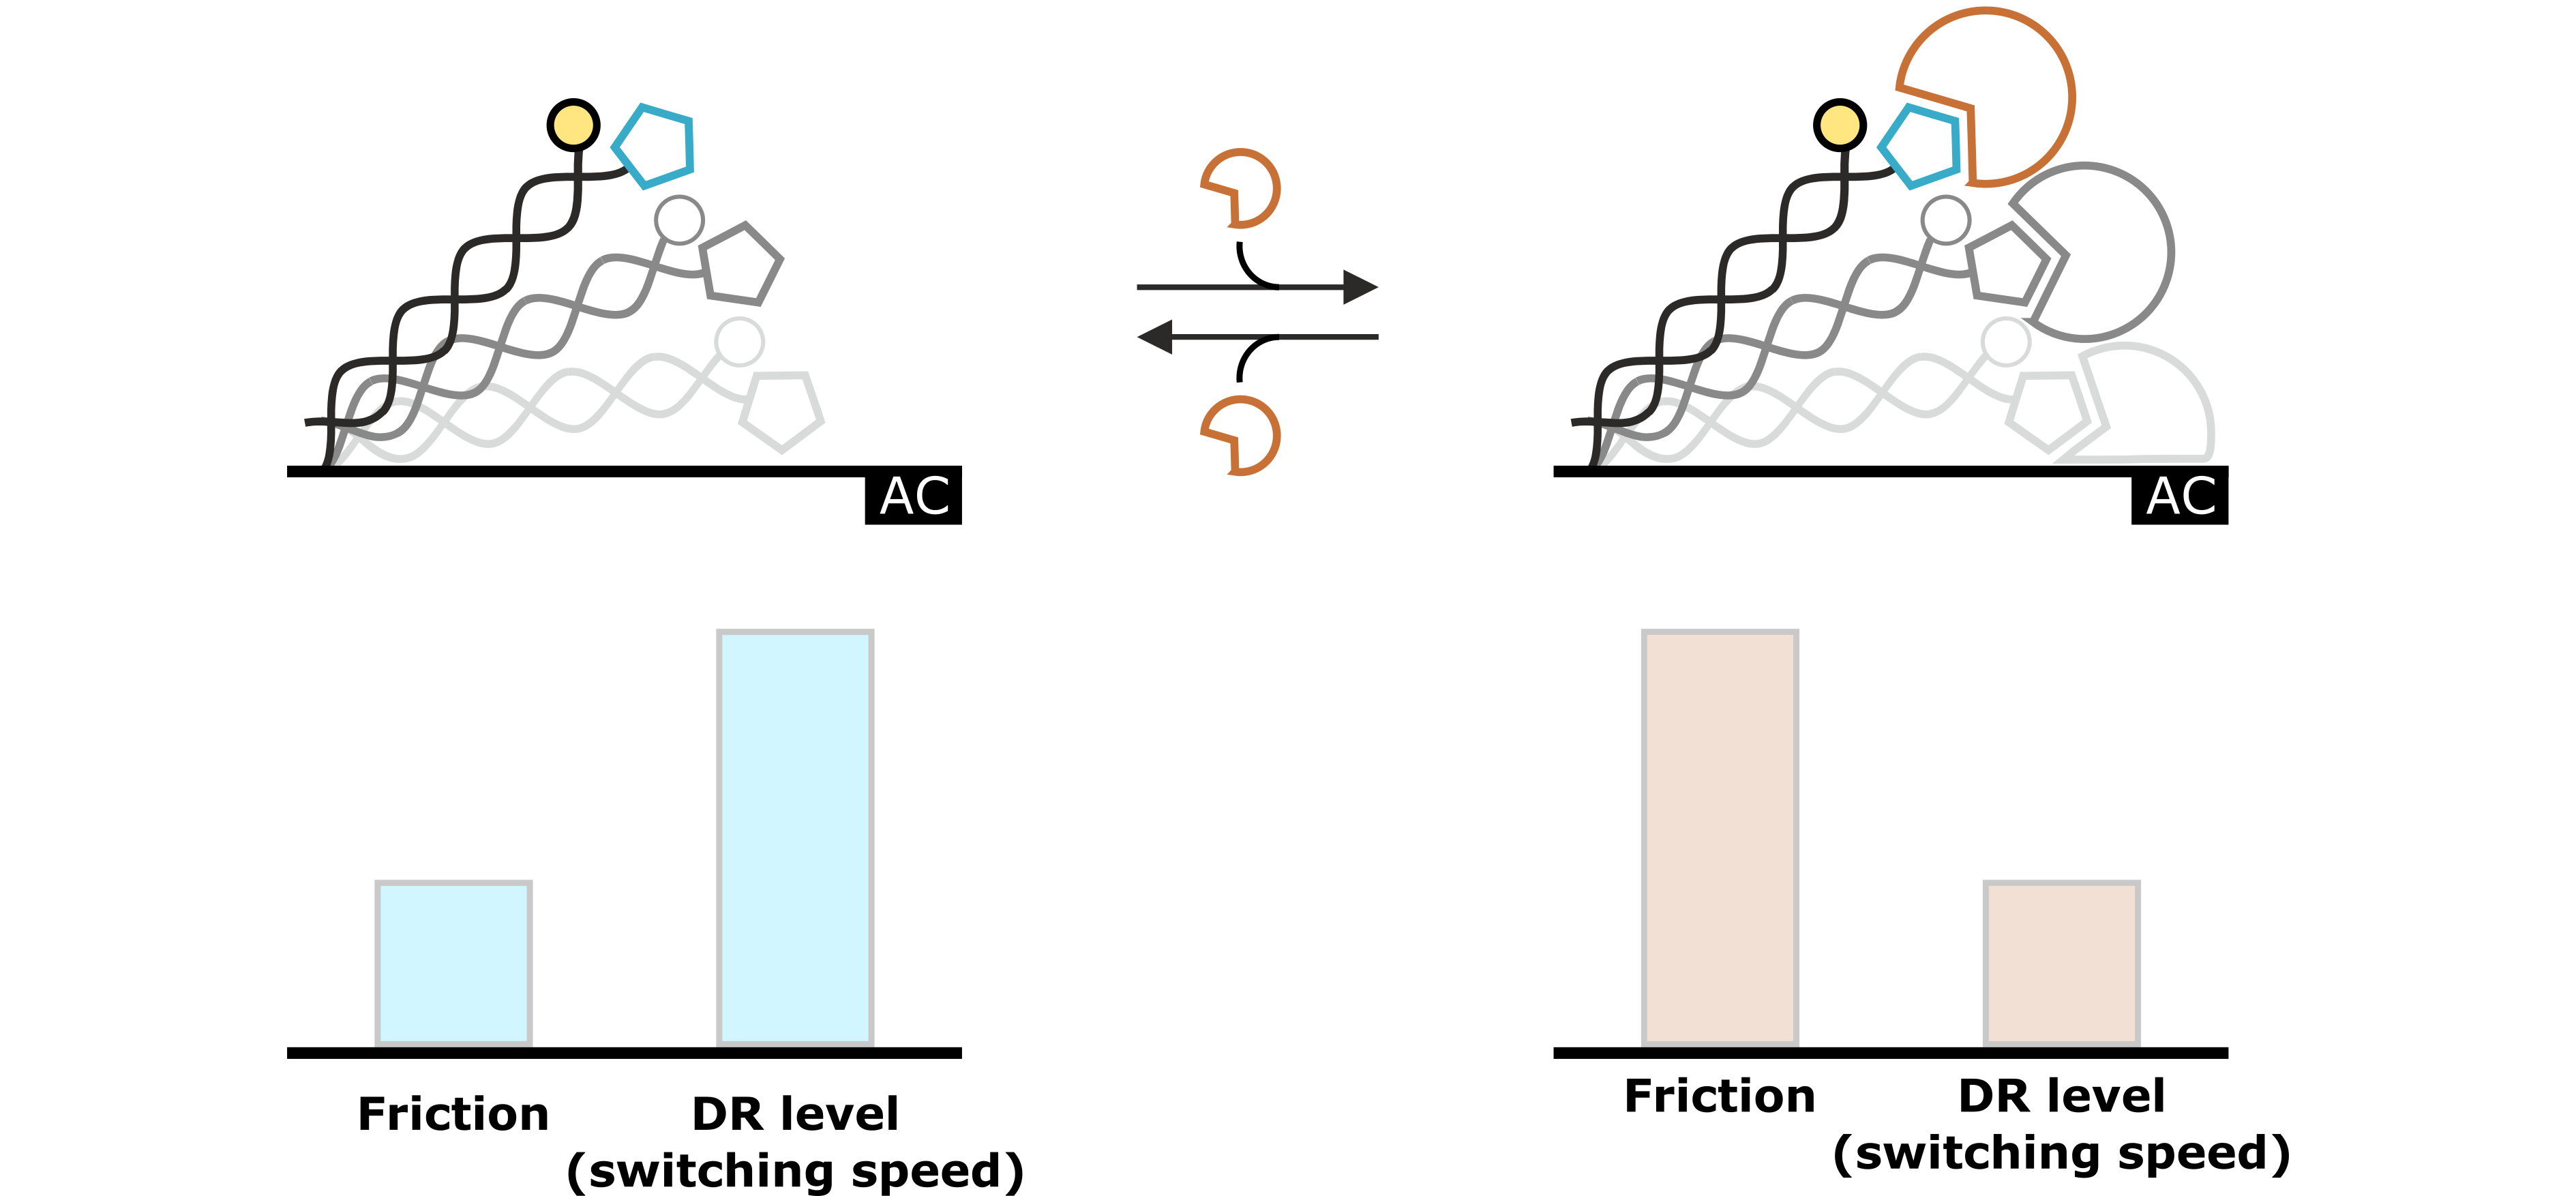
Figure 3: The molecular dynamics of the DNA switching process reflect the hydrodynamic drag, which is exerted on the DNA nanolevers. This specific hydrodynamic drag is characterized by the nanolever’s switching speed, which can be quantified by the Dynamic Response (DR) level. Changes that affect the hydrodynamic conditions (e.g. analyte association) are reflected in changes of the DR value.
Protein Sizing
The size of a molecule can be described using the hydrodynamic diameter (DH), which corresponds to the diameter of a perfect sphere with the same hydrodynamic friction coefficient as the molecule of interest. DH of proteins or protein complexes can be determined using a mathematical model to describe the hydrodynamics of the switching motion of the DNA nanolevers. This so-called Lollipop Model treats the DNA nanolevers as charged and rigid cylinders that carry a spherical molecule at the distal end (Figure 4). Solutions to this model provide the hydrodynamic diameter of the attached molecule in nanometers.

Figure 4: The lollipop model mathematically simplifies the hydrodynamic properties of DNA nanolevers with attached protein molecules by assuming that the DNA is a charged and rigid cylinder that carries a spherical body on top. Solutions of the lollipop model provide the hydrodynamic diameter of the attached protein in nanometers.
Fluorescence Proximity Sensing (FPS)
FPS changes in the local environment of the fluorophore are detected by changes in the intensity of the fluorescence emission. The fluorescence emission can either be enhanced or decreased, for instance by changes in the local hydrophobicity.
A typical application of FPS is the real-time detection of the association of an analyte to an immobilized ligand molecule. Figure 5 shows an example of how binding of an analyte can be observed as a quenching effect of the fluorophore. Due to the permanent Brownian motion of the fluorescent dye, it constantly probes its local environment, which results in a specific fluorescence emission. Once the local environment of the dye is changed resulting from association of the analyte, the fluorophore probes an altered molecular surface, thus sensing the presence of the analyte molecule. This results in the presented example in a decreased fluorescence emission.
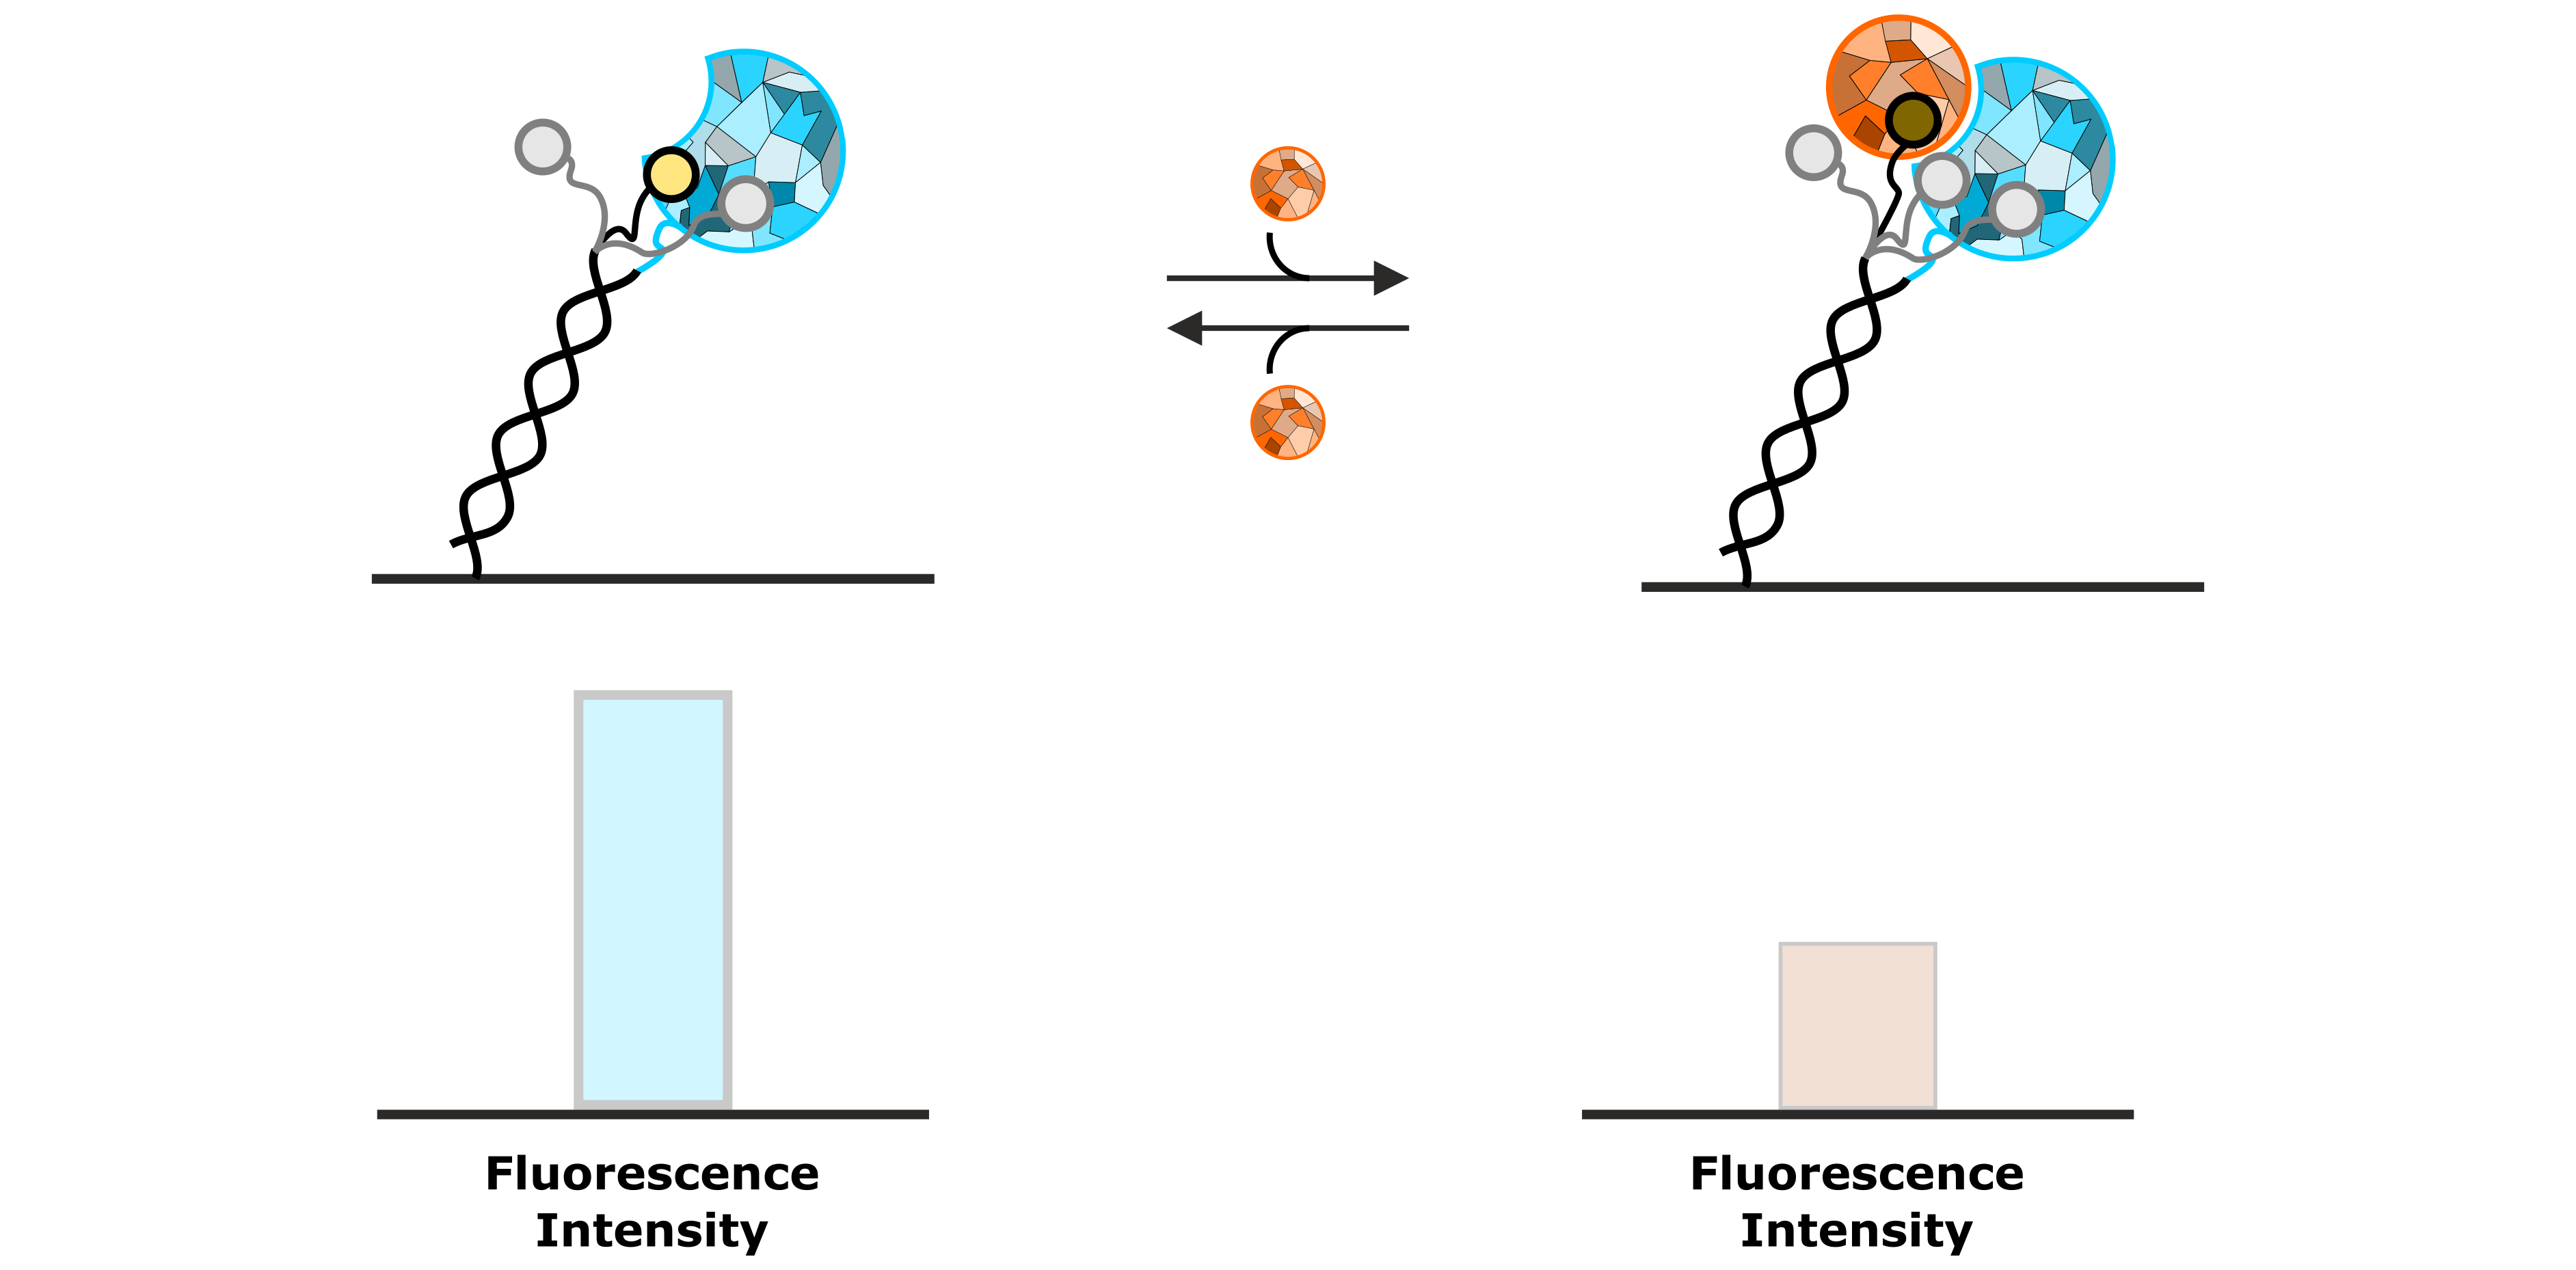
Figure 5: Permanent sensing of its local environment causes the fluorescent dye to emit a specific intensity of fluorescent light. The association of an analyte molecule influences the local environment, resulting in a decrease of fluorescence emission.
An example, in which the fluorescence intensity is increased upon association of an analyte molecule, is shown in Figure 6. In this case, the fluorophore possesses a certain affinity to the immobilized ligand molecule, for instance to a hydrophobic enzymatic cleft of the test protein. While the fluorophore is bound to the immobilized protein, the fluorescence emission is quenched. The interaction with a specific analyte molecule interrupts the weak interaction between fluorophore and protein by displacing the dye. The released fluorophore can now move freely and is not quenched anymore, which can be observed as an increased intensity of the fluorescent light.
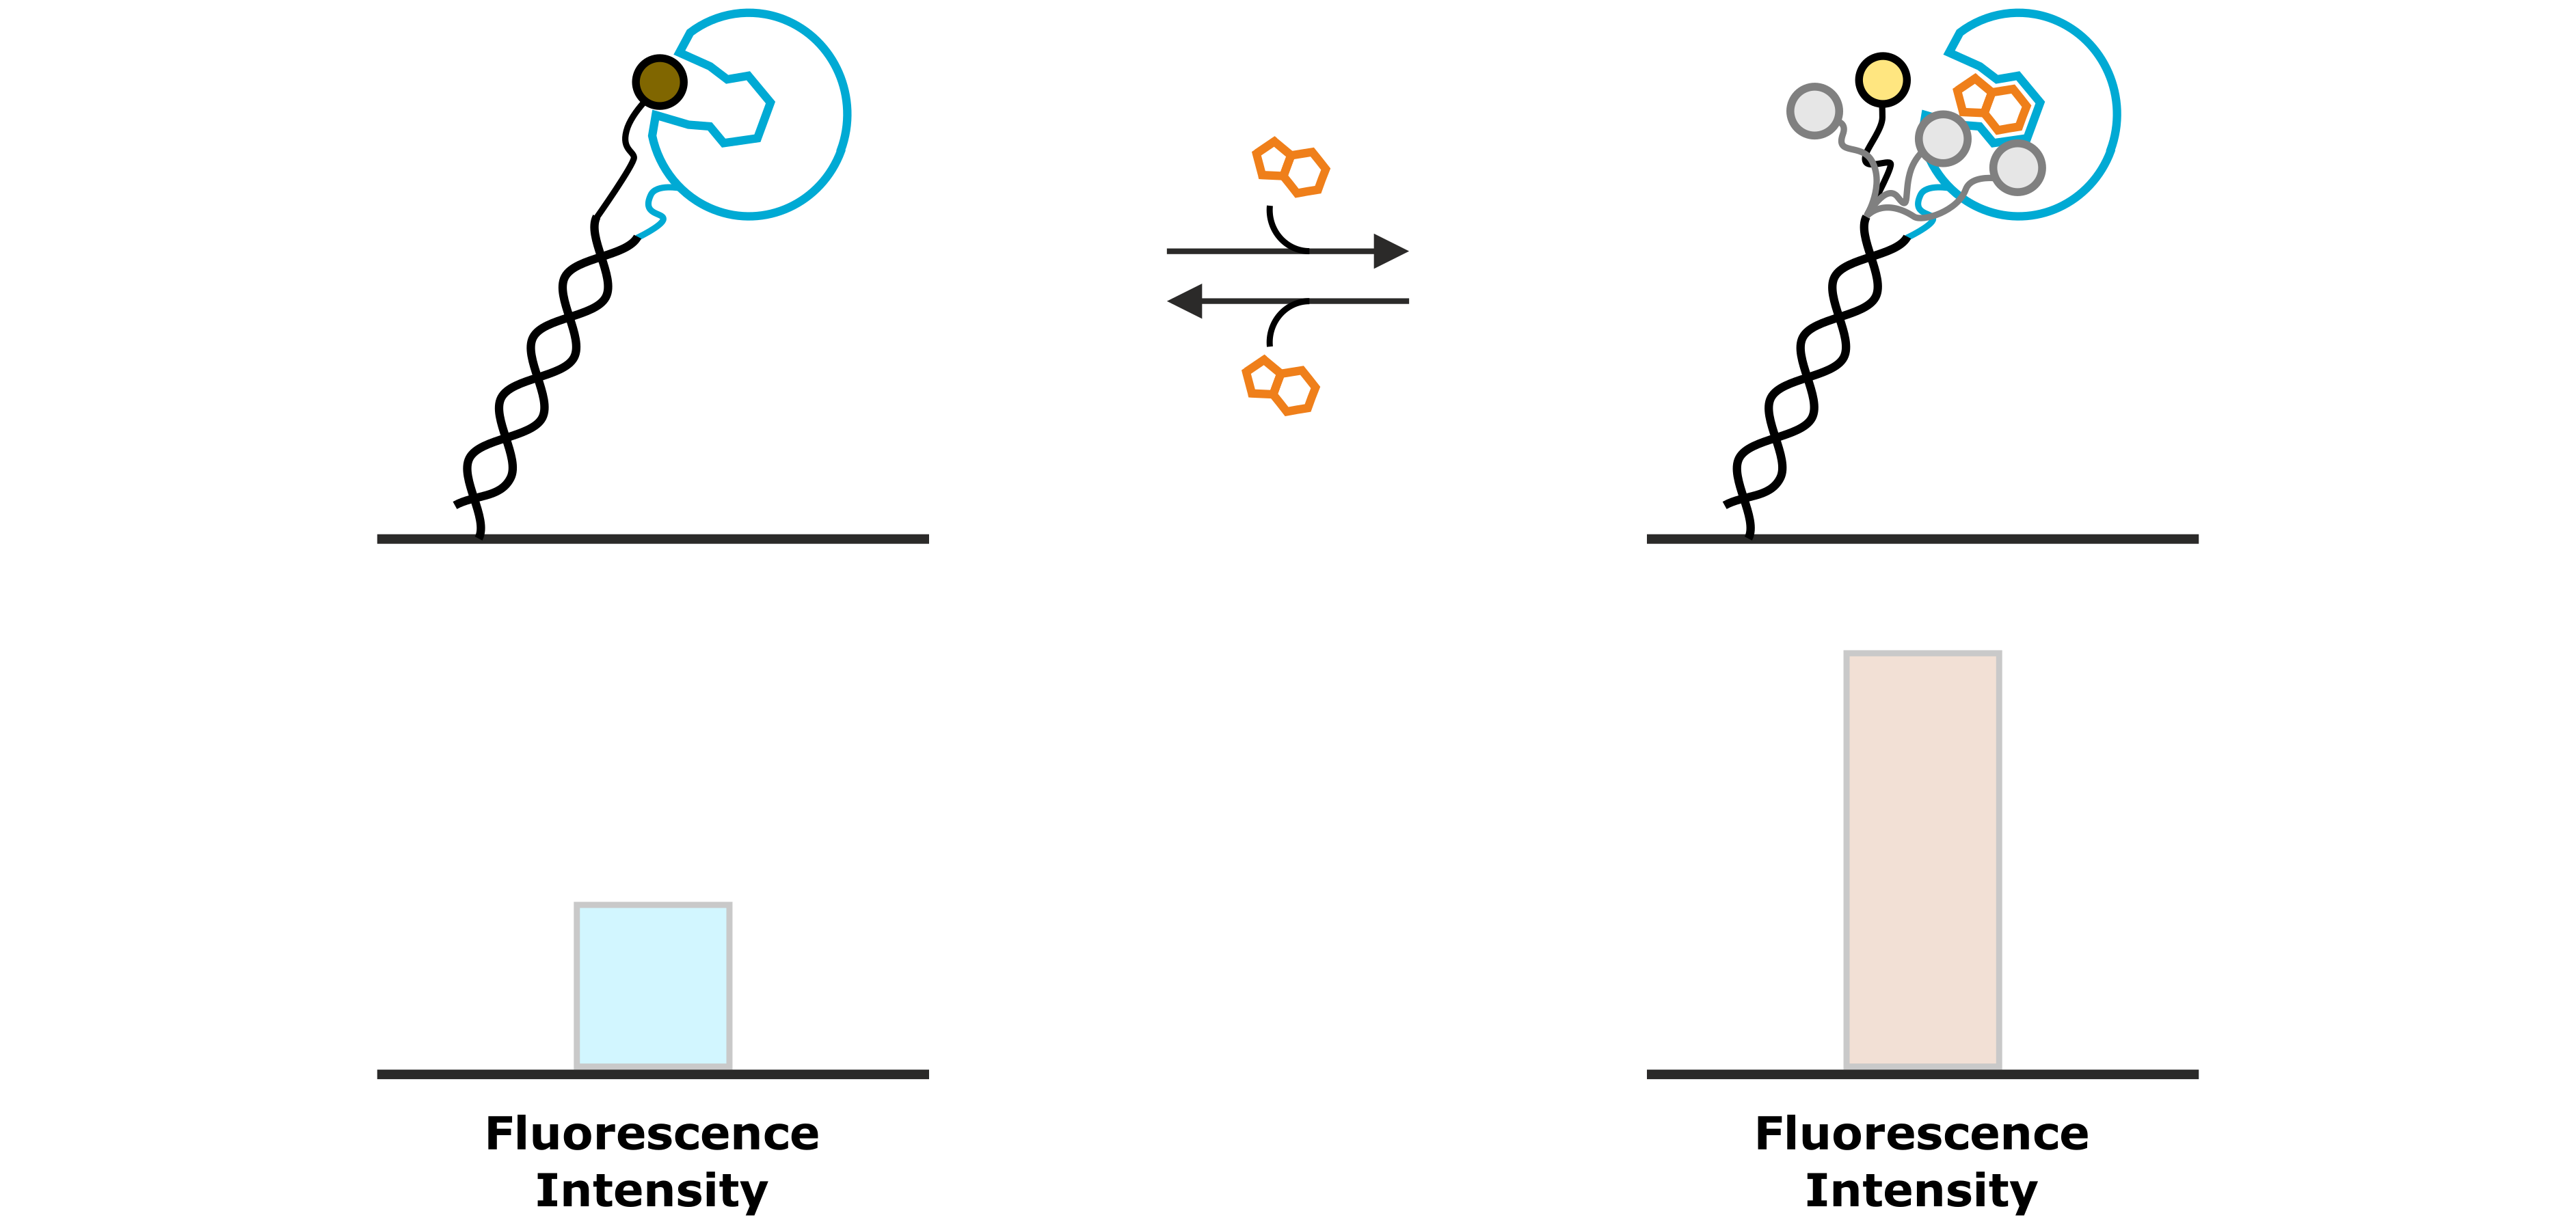
Figure 6: A weak interaction between the fluorescent dye and the immobilized ligand molecule results in a low base-line fluorescence intensity, due to the quenching of the fluorophore. A specifically binding analyte competes with the fluorophore and displaces it from the protein, thus enhancing its fluorescence intensity.
Molecular Ruler
The second analysis signal that utilizes the absolute fluorescence intensity of the fluorophore as read out, is the Molecular Ruler analysis. While FPS detects changes in the local environment of the fluorescent dye, effects that can be detected from a Molecular Ruler signal, affect the average distance of the fluorophore to the gold surface and thus the degree of fluorescence quenching. Examples of such processes are association of DNA-binding proteins that change the DNA conformation (e.g. by bending; Figure 7) or enzymatic DNA elongation by polymerases. Figure 8 explains the Molecular Ruler principle using the example of a polymerase driven DNA elongation.
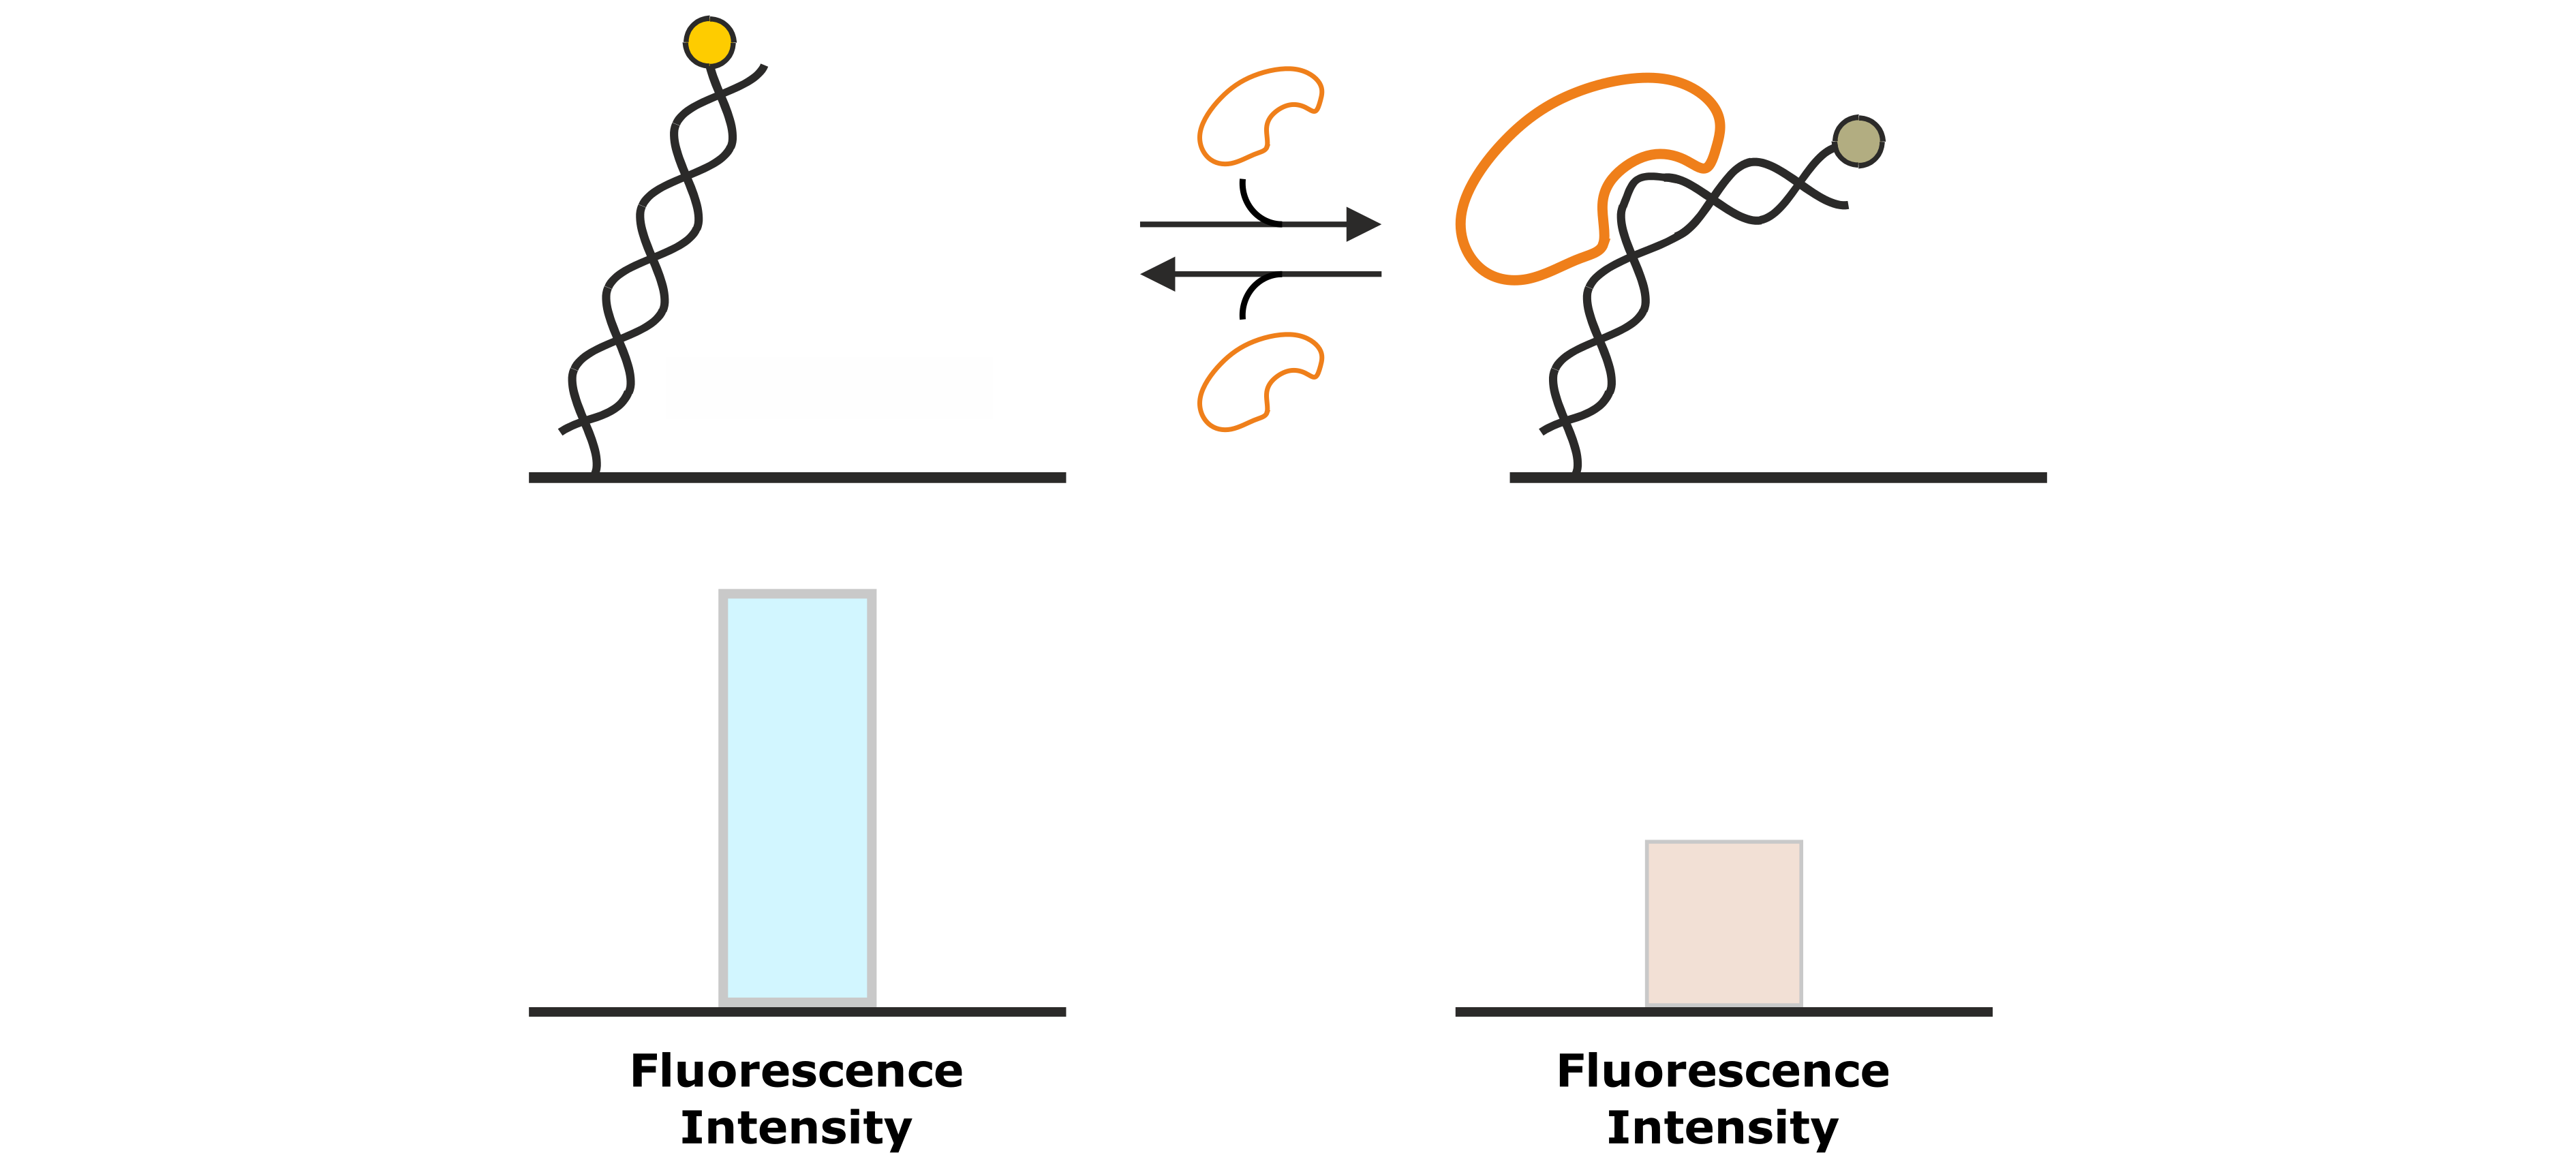
Figure 7: DNA binding proteins that associate to the DNA backbone often cause a conformational change of the DNA by bending of the double helix. This changes the position of the fluorescent dye at the distal end of the DNA nanolever, which is associated by a change in fluorescence intensity.
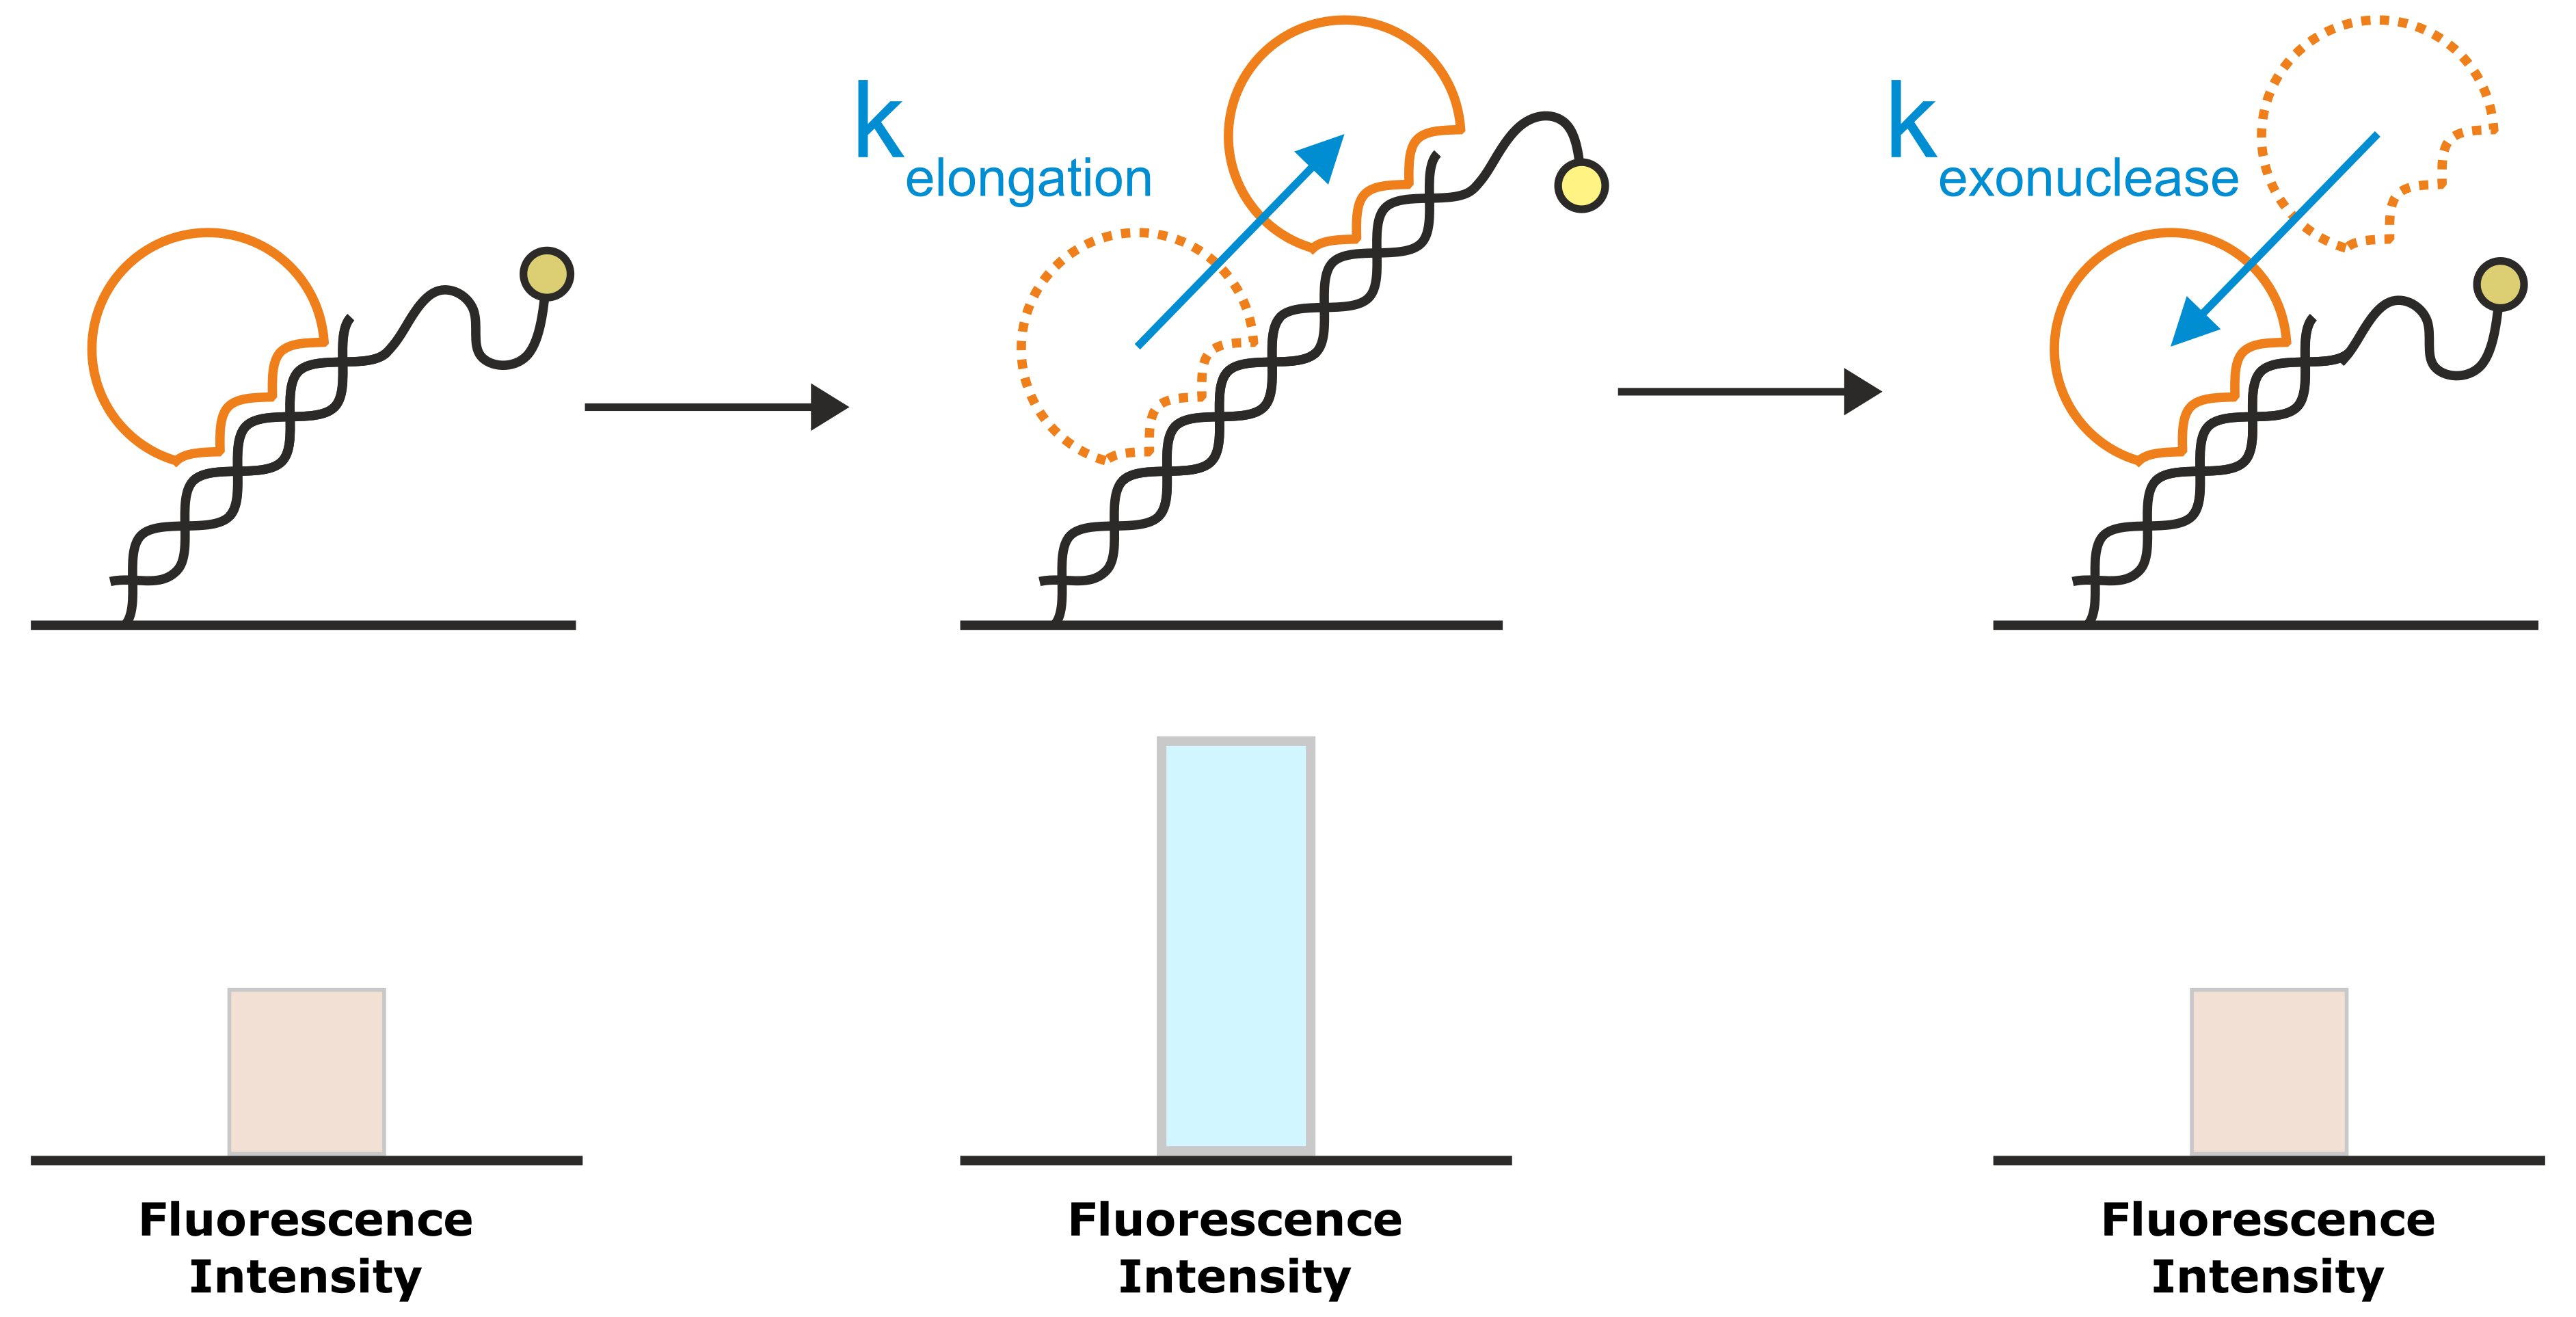
Figure 8: A very common application of the Molecular Ruler principle is the investigation of DNA elongation kinetics by polymerases. The template for the DNA elongation is a double-stranded DNA nanolever that is modified with a single-stranded overhang. In the initial state, the partly single-stranded nanolevers exhibit a relatively low fluorescence intensity, owing to their high flexibility that allows them to approach the quenching gold surface. Once a polymerase starts to elongate the DNA, the single-stranded DNA overhang is converted into a rigid double-helix. The transition from the flexible single-strand DNA into the rigid double-strand moves the average position of the fluorophore further away from the gold surface, which results in an enhanced fluorescence intensity. For enzymes with exonuclease activity, the reverse approach yields a decrease in fluorescence intensity.