DRX
General Questions
For biophysical experiments, a switchSENSE® measurement combines two aspects:
- A fluorescence measurement, where the fluorophore emission intensity is subject to two influences:
- a non-radiative energy transfer to the metal electrode, which depends on the distance between the fluorophore and the metal surface
- quenching or enhancement of the fluorescence intensity of the dye due to the proximity between the dye and molecules bound within its probing environment.
- The electrical control over the orientation of end-tethered DNA nanolevers:
- either by applying a constant potential (mild negative potentials) to the electrode to align the DNA in a fixed, well-defined orientation (usually upright).
- or by applying alternating repulsive and attractive potentials to facilitate a dynamic oscillation of the DNA nanolever orientation.
This implies that a switchSENSE® experiment can be performed using two different approaches: with switching of the DNA nanolevers (dynamic mode) or without switching (static mode). These two measurement modes differ mainly in the electric potentials that are applied to the sensor electrodes. Experiments in dynamic mode are performed under constant orientation switching of the DNA nanolevers, actuated by oscillating potentials, which either attract or repel the DNA backbones.
In contrast to this, experiments in static mode are performed with a constant potential (usually negative) that keeps the DNA nanolevers static at a fixed angle. Figure 2 illustrates the two measurements modes.

Figure 2: switchSENSE® measurement modes. In dynamic mode, the potentials applied to the sensor electrodes are alternated, which drives the DNA nanolevers to oscillate on the electrode’s surface due to their negatively charged backbone. When using the static mode, usually a constant negative potential is applied, which positions the DNA nanolevers constantly in an upright conformation.
Experiments in dynamic mode provide the following evaluation parameters:
- Molecular dynamics: hydrodynamic changes can be detected as changes in the Dynamic Response.
- Protein sizing: the hydrodynamic diameter (DH) of proteins, protein complexes or of folded nucleic acids can be determined using the Lollipop model.
- Fluorescence proximity sensing (FPS): changes in the local environment of the fluorophore are detected from the changes in the intensity of the fluorescence emission.
- Molecular ruler: changes in the average position of the fluorophore with respect to the gold surface can be determined by observation of the fluorescence intensity.
When to use best:
- When working at salt concentrations up to physiological conditions.
- Experiments with small ligand molecule relative to a larger analyte molecule provide best signal to noise ratio in molecular dynamics.
Advantages compared to static mode:
- Full experimental information content is provided
- Excellent long-term signal stability during kinetic experiments
Experiments in static mode provide the following evaluation parameters:
- Fluorescence proximity sensing (FPS): changes in the local environment of the fluorophore are detected by changes in the intensity of the fluorescence emission.
- Molecular ruler: changes in the average position of the fluorophore with respect to the gold surface can be determined by observation of the fluorescence intensity.
Advantages compared to dynamic mode:
- Improved signal to noise ratio and higher sensitivity for FPS analysis
- Extended chip lifetime
switchSENSE® is a biophysical research technology to investigate molecular interactions. The core of this technology are DNA nanolevers attached to gold microelectrodes. These DNA nanolevers can easily be customized with any ligand of choice. The orientation of the nanolevers can be controlled by applying voltage to the microelectrodes. We differentiate two measurement modes in switchSENSE® experiments, the dynamic mode and the static mode. In dynamic mode, an alternating voltage is applied, causing the negatively charged DNA nanolevers to oscillate at high frequencies. In static mode, a negative voltage is applied to hold the nanolevers in a static, upright orientation. The nanolevers are additionally equipped with a fluorescent dye. The readout signal of a switchSENSE® experiment is a change in fluorescence intensity. This can be caused by multiple events. For example, the local environment of the dye can change due to e.g. binding of an analyte to the ligand. Furthermore, the gold electrode surface quenches the dye, thus changes in the distance between the dye and the sensor surface will affect the fluorescence intensity. Some assays also include a second fluorescent dye and changes in intensity are caused by Förster resonance energy transfer (FRET) between the two dyes (see Which options do I have for dual-color assays? for details). Based on these measurement modes you can characterize your molecular interactions in great detail, ranging from kinetic rates to conformational changes of binding partners. Find out more about the technical details of switchSENSE® here.
Molecular Dynamics
Hydrodynamic changes can be detected as changes in the Dynamic Response. Generally, events that increase the hydrodynamic friction, such as binding of an analyte molecule to the ligand, result in a slower switching motion, which can be observed as a decrease of the Dynamic Response. On the contrary, events that reduce the hydrodynamic friction, for example during conformational changes, cause the DNA nanolevers to switch faster, which can be observed as an increase in Dynamic Response.
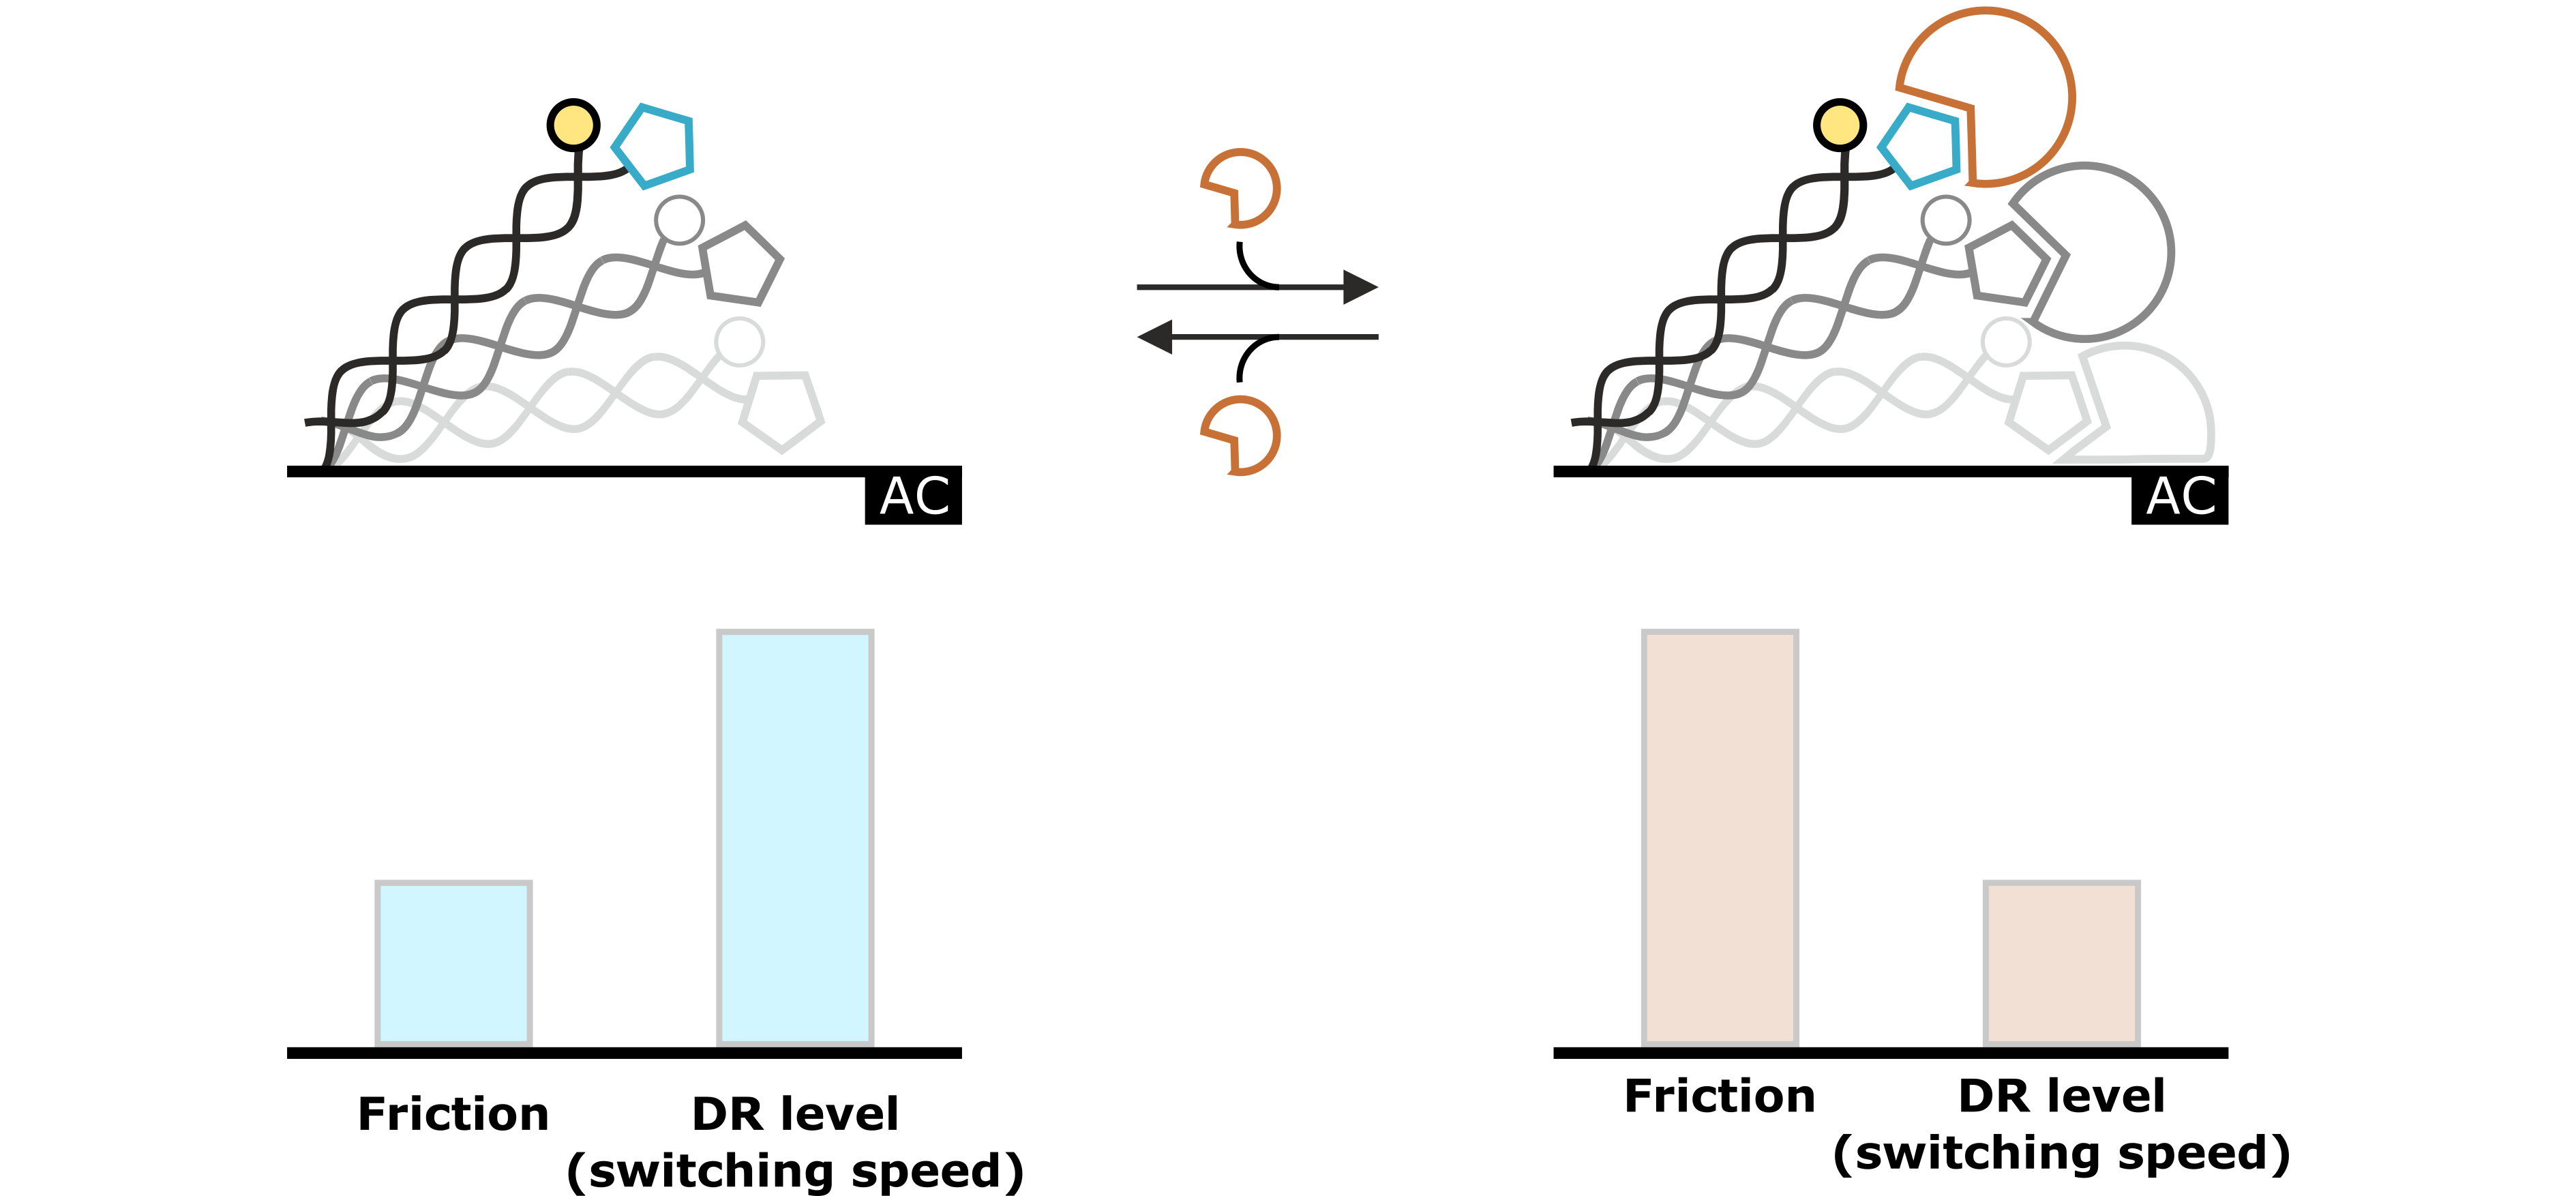
Figure 3: The molecular dynamics of the DNA switching process reflect the hydrodynamic drag, which is exerted on the DNA nanolevers. This specific hydrodynamic drag is characterized by the nanolever’s switching speed, which can be quantified by the Dynamic Response (DR) level. Changes that affect the hydrodynamic conditions (e.g. analyte association) are reflected in changes of the DR value.
Protein Sizing
The size of a molecule can be described using the hydrodynamic diameter (DH), which corresponds to the diameter of a perfect sphere with the same hydrodynamic friction coefficient as the molecule of interest. DH of proteins or protein complexes can be determined using a mathematical model to describe the hydrodynamics of the switching motion of the DNA nanolevers. This so-called Lollipop Model treats the DNA nanolevers as charged and rigid cylinders that carry a spherical molecule at the distal end (Figure 4). Solutions to this model provide the hydrodynamic diameter of the attached molecule in nanometers.

Figure 4: The lollipop model mathematically simplifies the hydrodynamic properties of DNA nanolevers with attached protein molecules by assuming that the DNA is a charged and rigid cylinder that carries a spherical body on top. Solutions of the lollipop model provide the hydrodynamic diameter of the attached protein in nanometers.
Fluorescence Proximity Sensing (FPS)
FPS changes in the local environment of the fluorophore are detected by changes in the intensity of the fluorescence emission. The fluorescence emission can either be enhanced or decreased, for instance by changes in the local hydrophobicity.
A typical application of FPS is the real-time detection of the association of an analyte to an immobilized ligand molecule. Figure 5 shows an example of how binding of an analyte can be observed as a quenching effect of the fluorophore. Due to the permanent Brownian motion of the fluorescent dye, it constantly probes its local environment, which results in a specific fluorescence emission. Once the local environment of the dye is changed resulting from association of the analyte, the fluorophore probes an altered molecular surface, thus sensing the presence of the analyte molecule. This results in the presented example in a decreased fluorescence emission.
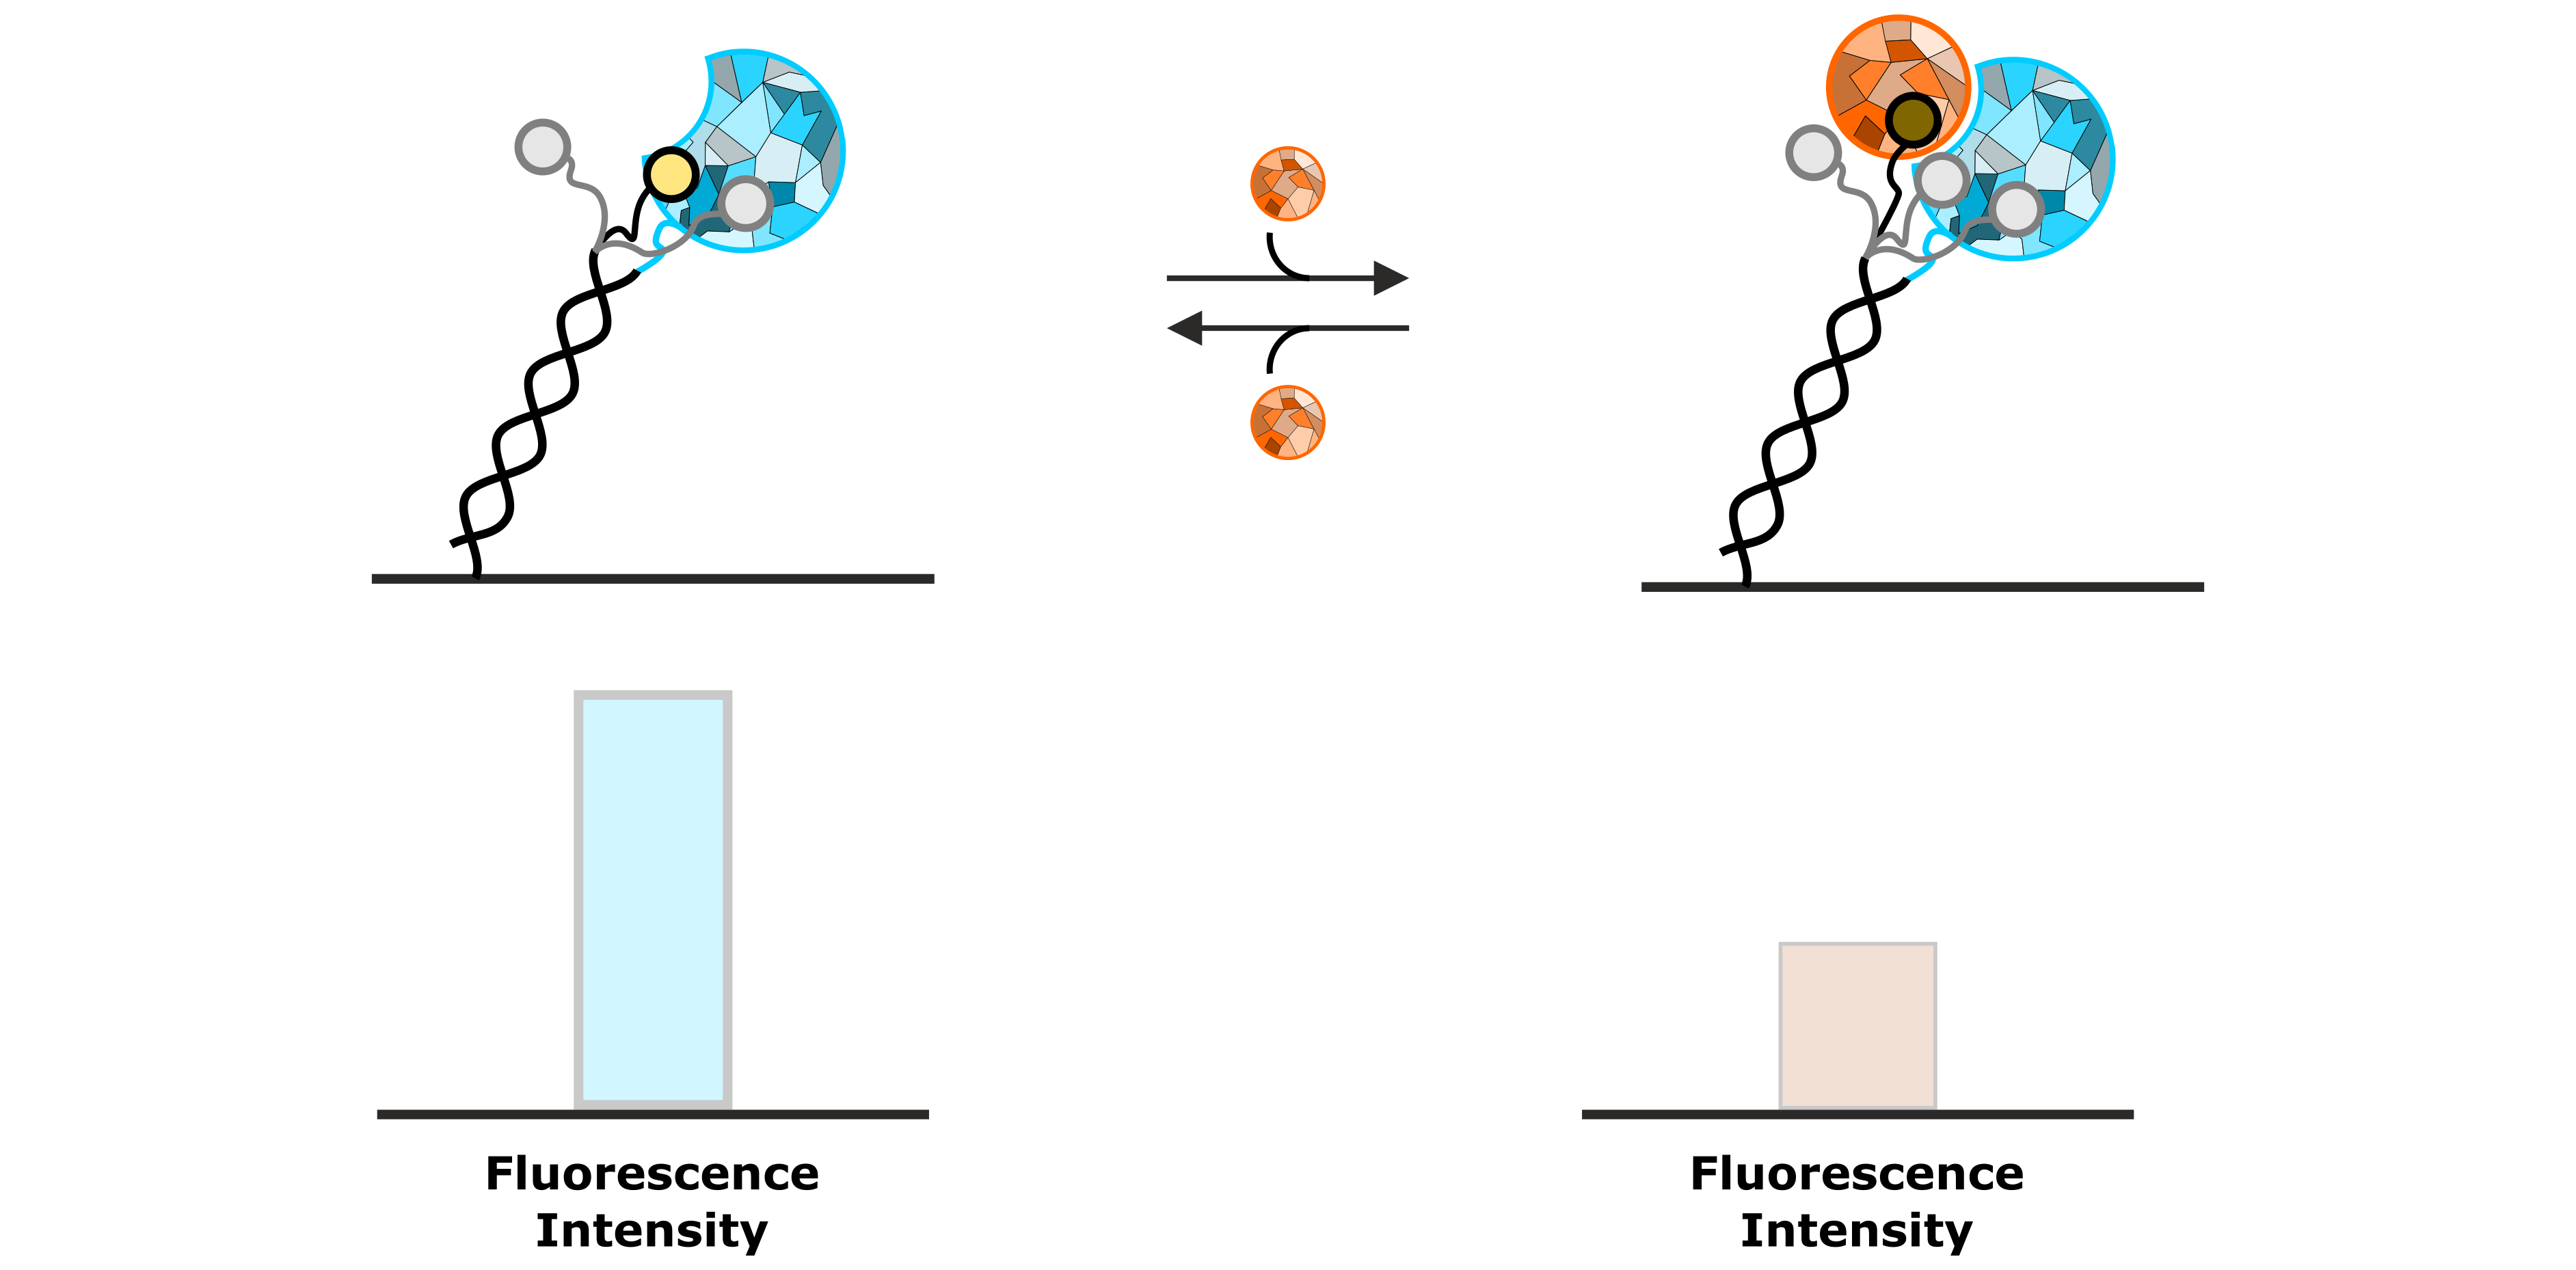
Figure 5: Permanent sensing of its local environment causes the fluorescent dye to emit a specific intensity of fluorescent light. The association of an analyte molecule influences the local environment, resulting in a decrease of fluorescence emission.
An example, in which the fluorescence intensity is increased upon association of an analyte molecule, is shown in Figure 6. In this case, the fluorophore possesses a certain affinity to the immobilized ligand molecule, for instance to a hydrophobic enzymatic cleft of the test protein. While the fluorophore is bound to the immobilized protein, the fluorescence emission is quenched. The interaction with a specific analyte molecule interrupts the weak interaction between fluorophore and protein by displacing the dye. The released fluorophore can now move freely and is not quenched anymore, which can be observed as an increased intensity of the fluorescent light.
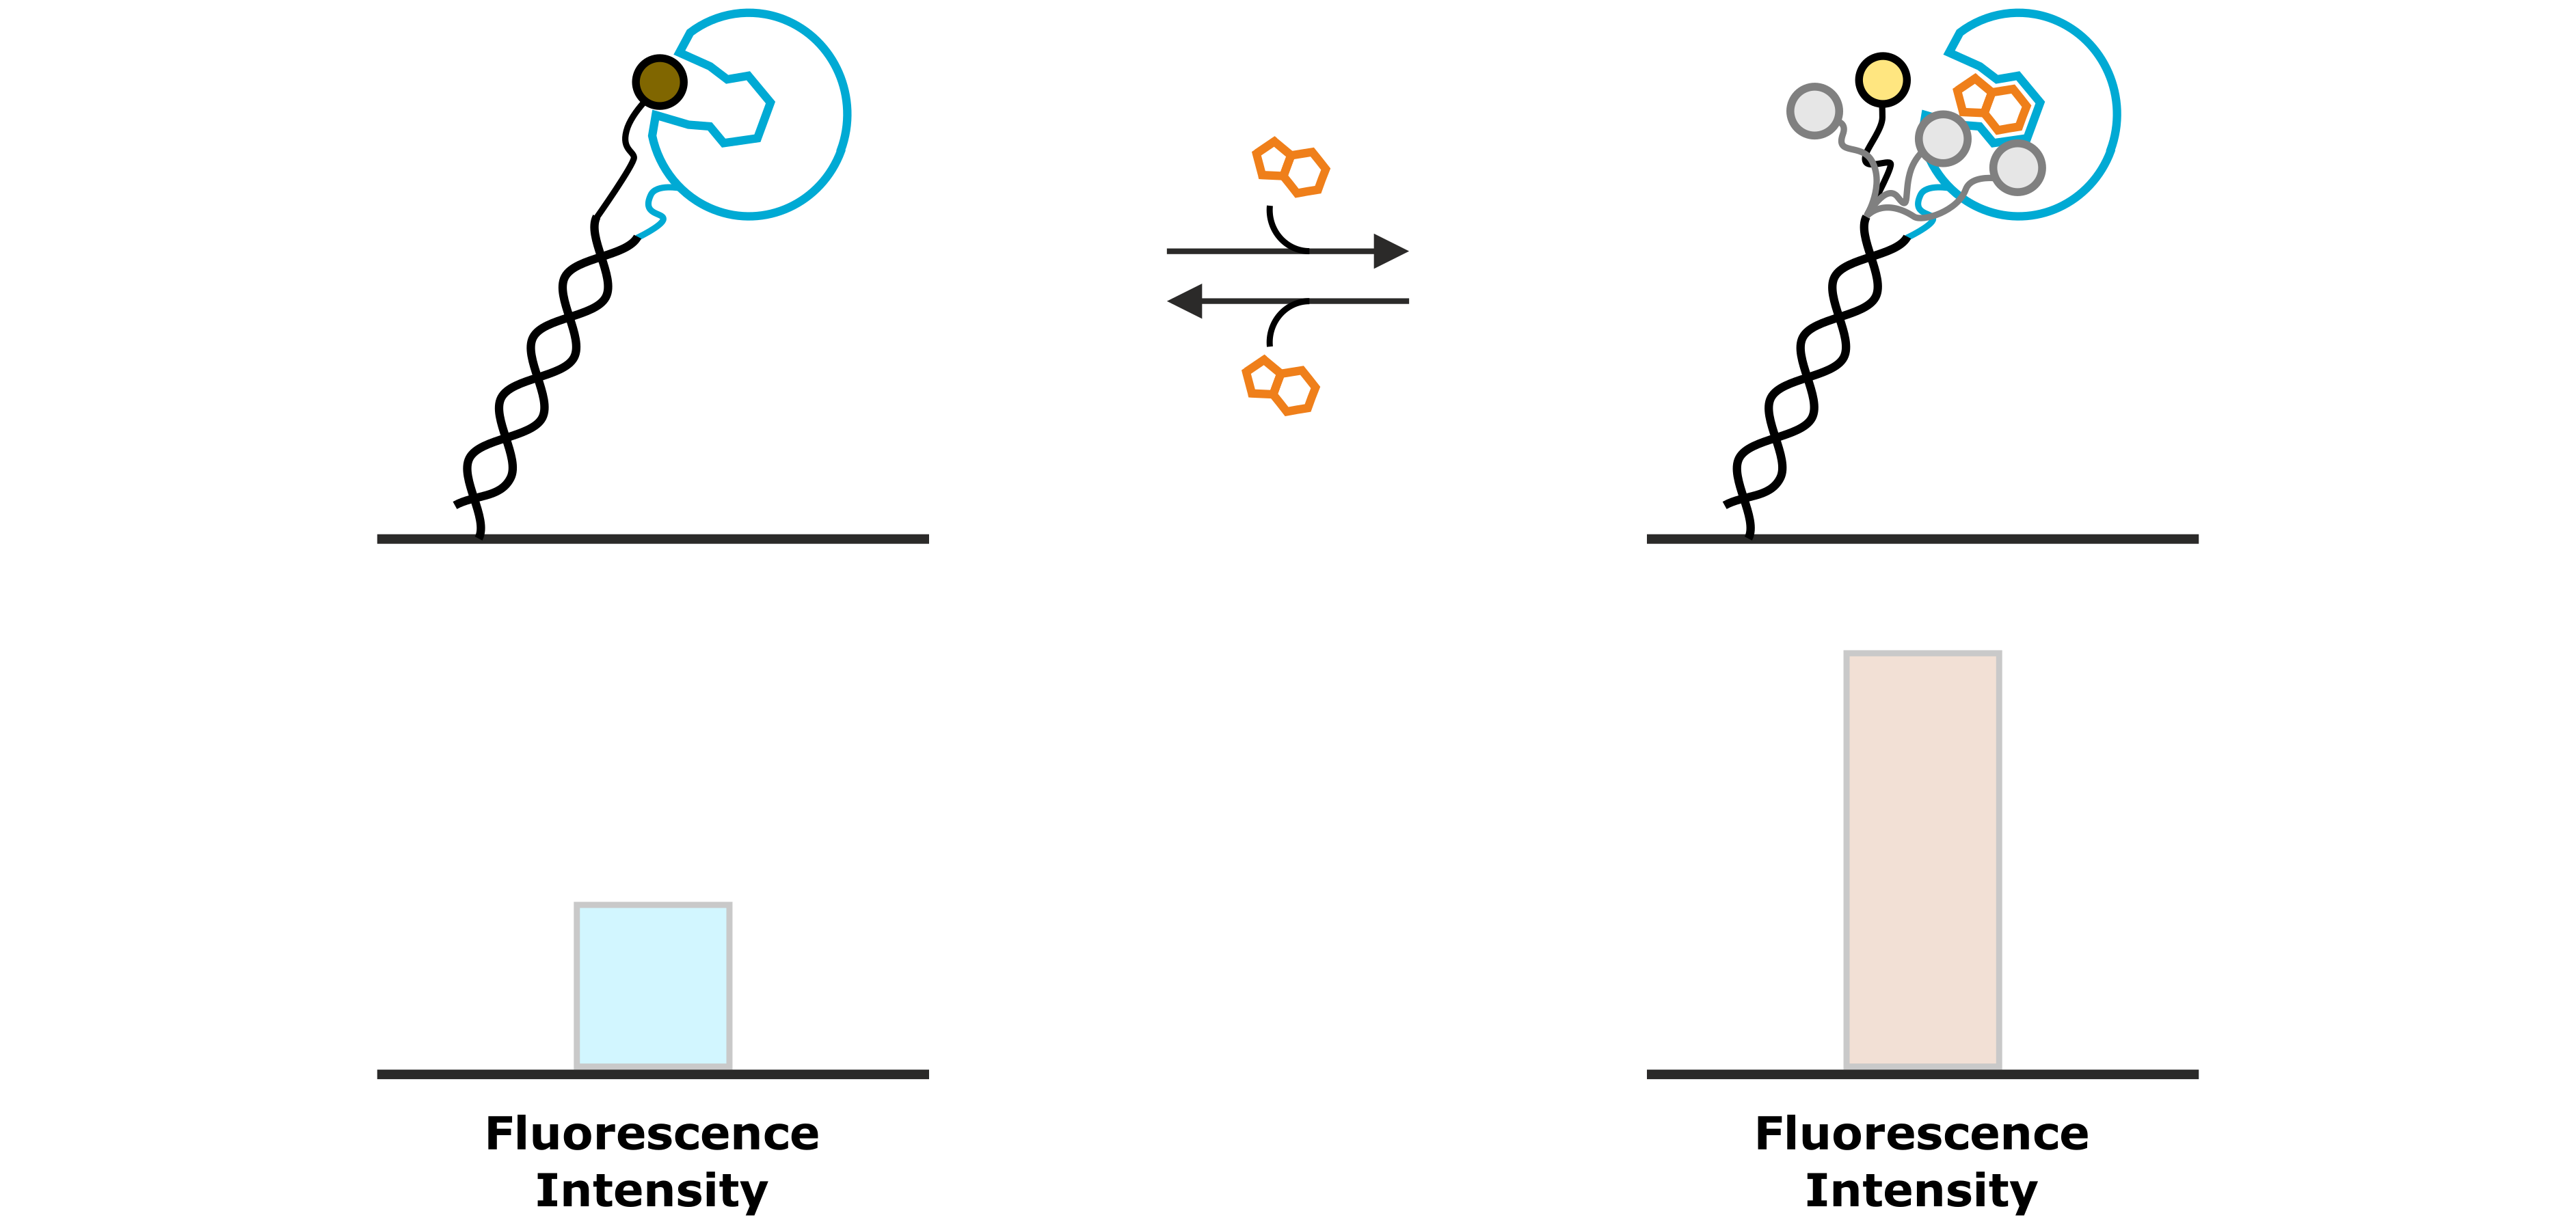
Figure 6: A weak interaction between the fluorescent dye and the immobilized ligand molecule results in a low base-line fluorescence intensity, due to the quenching of the fluorophore. A specifically binding analyte competes with the fluorophore and displaces it from the protein, thus enhancing its fluorescence intensity.
Molecular Ruler
The second analysis signal that utilizes the absolute fluorescence intensity of the fluorophore as read out, is the Molecular Ruler analysis. While FPS detects changes in the local environment of the fluorescent dye, effects that can be detected from a Molecular Ruler signal, affect the average distance of the fluorophore to the gold surface and thus the degree of fluorescence quenching. Examples of such processes are association of DNA-binding proteins that change the DNA conformation (e.g. by bending; Figure 7) or enzymatic DNA elongation by polymerases. Figure 8 explains the Molecular Ruler principle using the example of a polymerase driven DNA elongation.
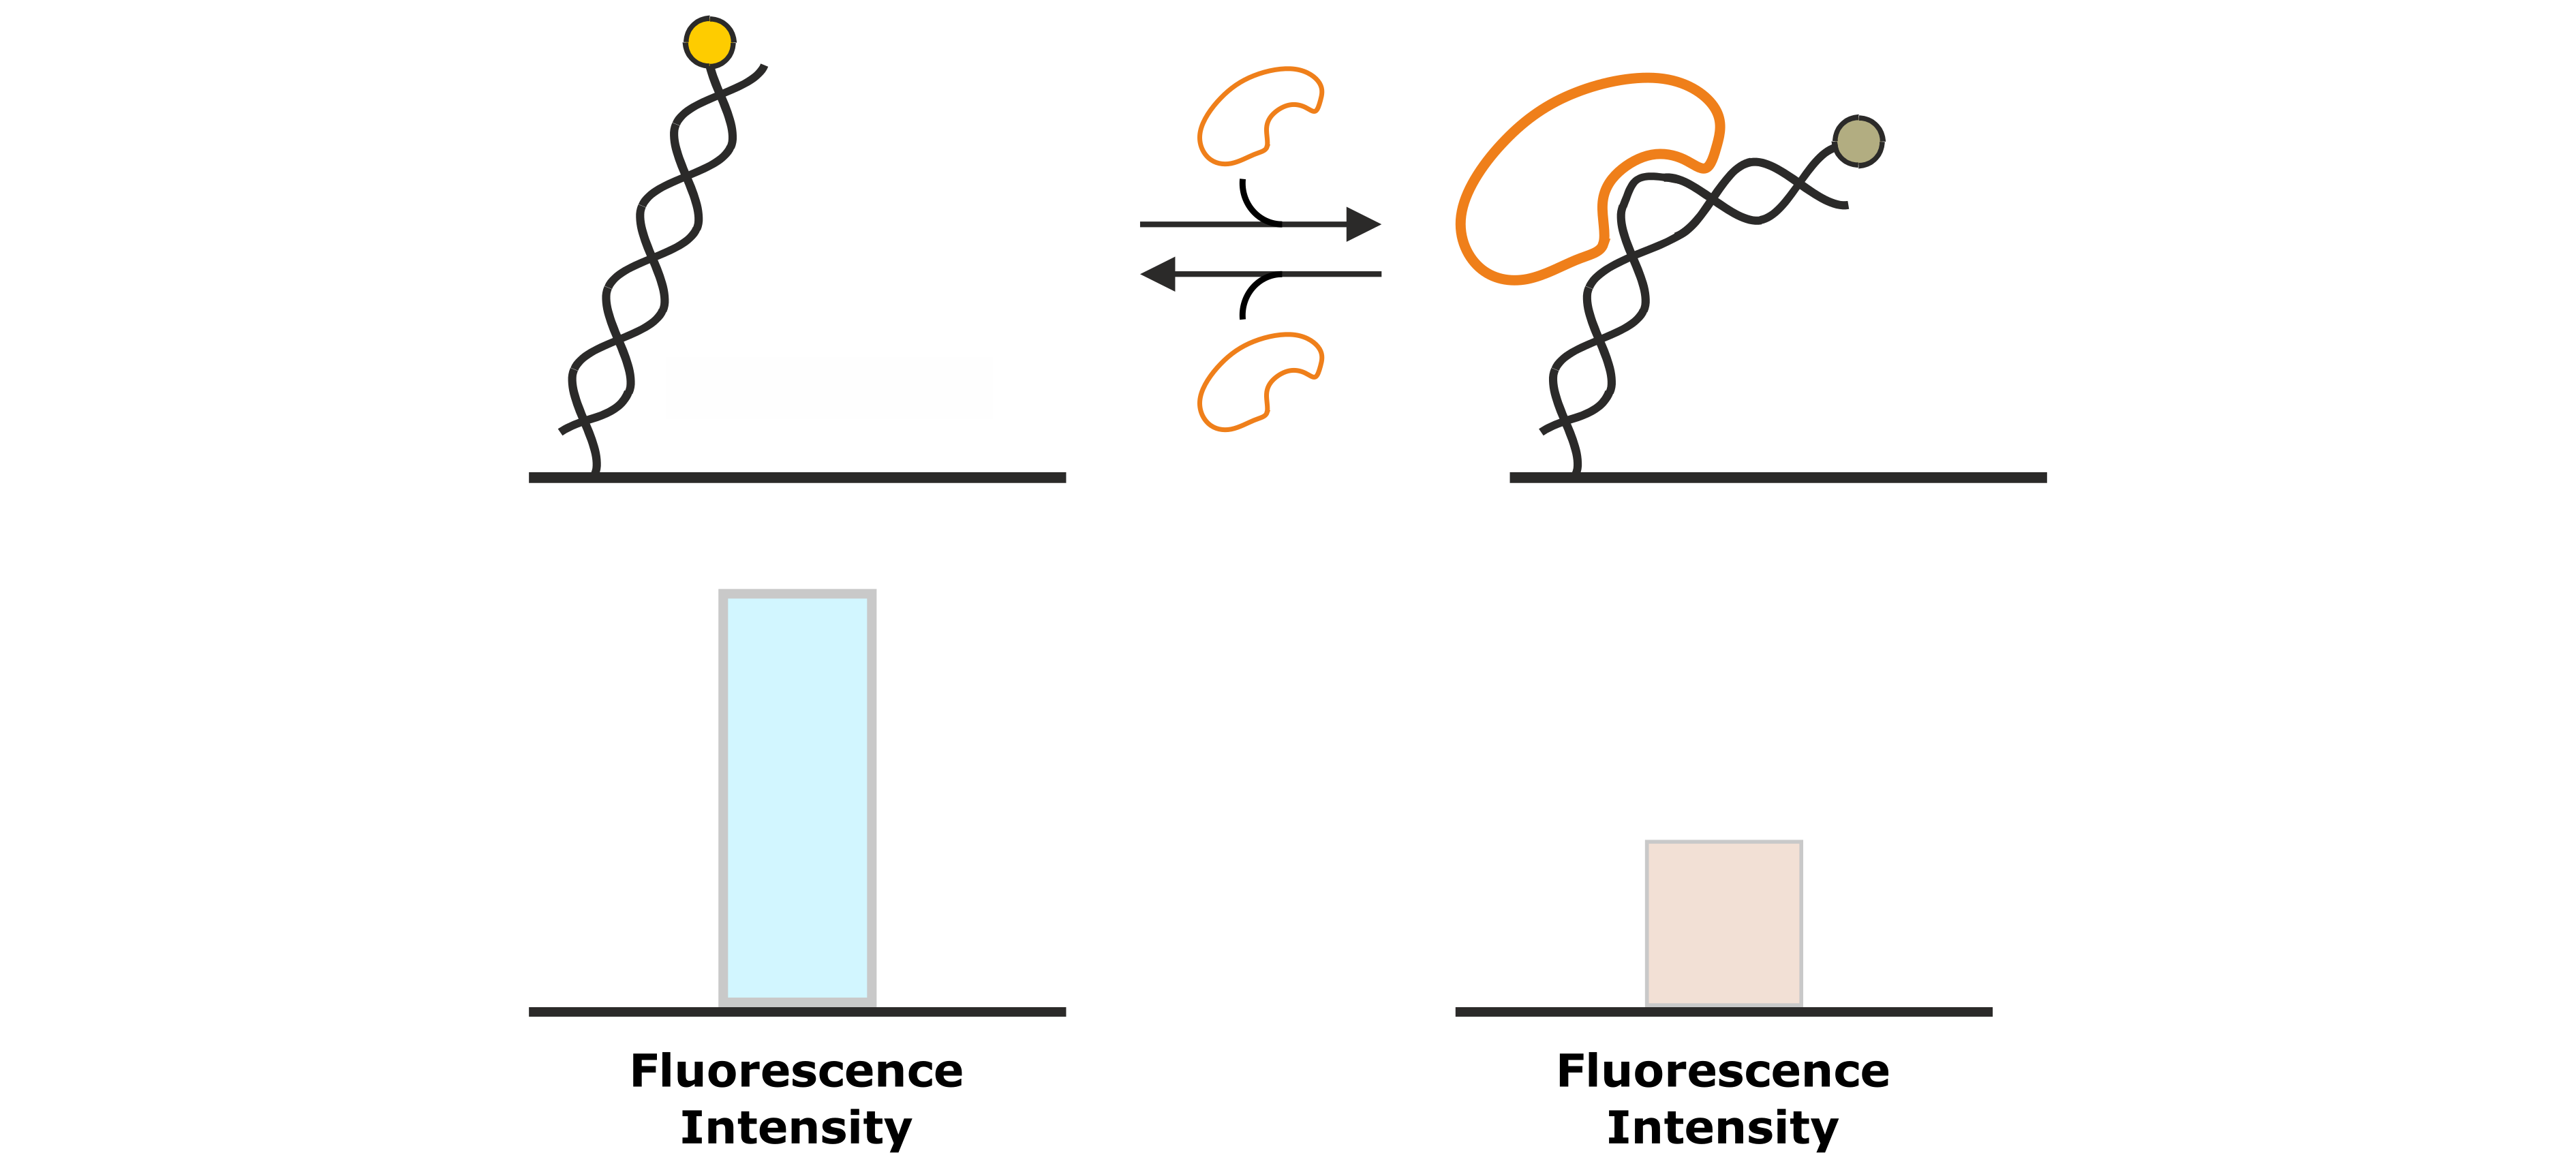
Figure 7: DNA binding proteins that associate to the DNA backbone often cause a conformational change of the DNA by bending of the double helix. This changes the position of the fluorescent dye at the distal end of the DNA nanolever, which is associated by a change in fluorescence intensity.
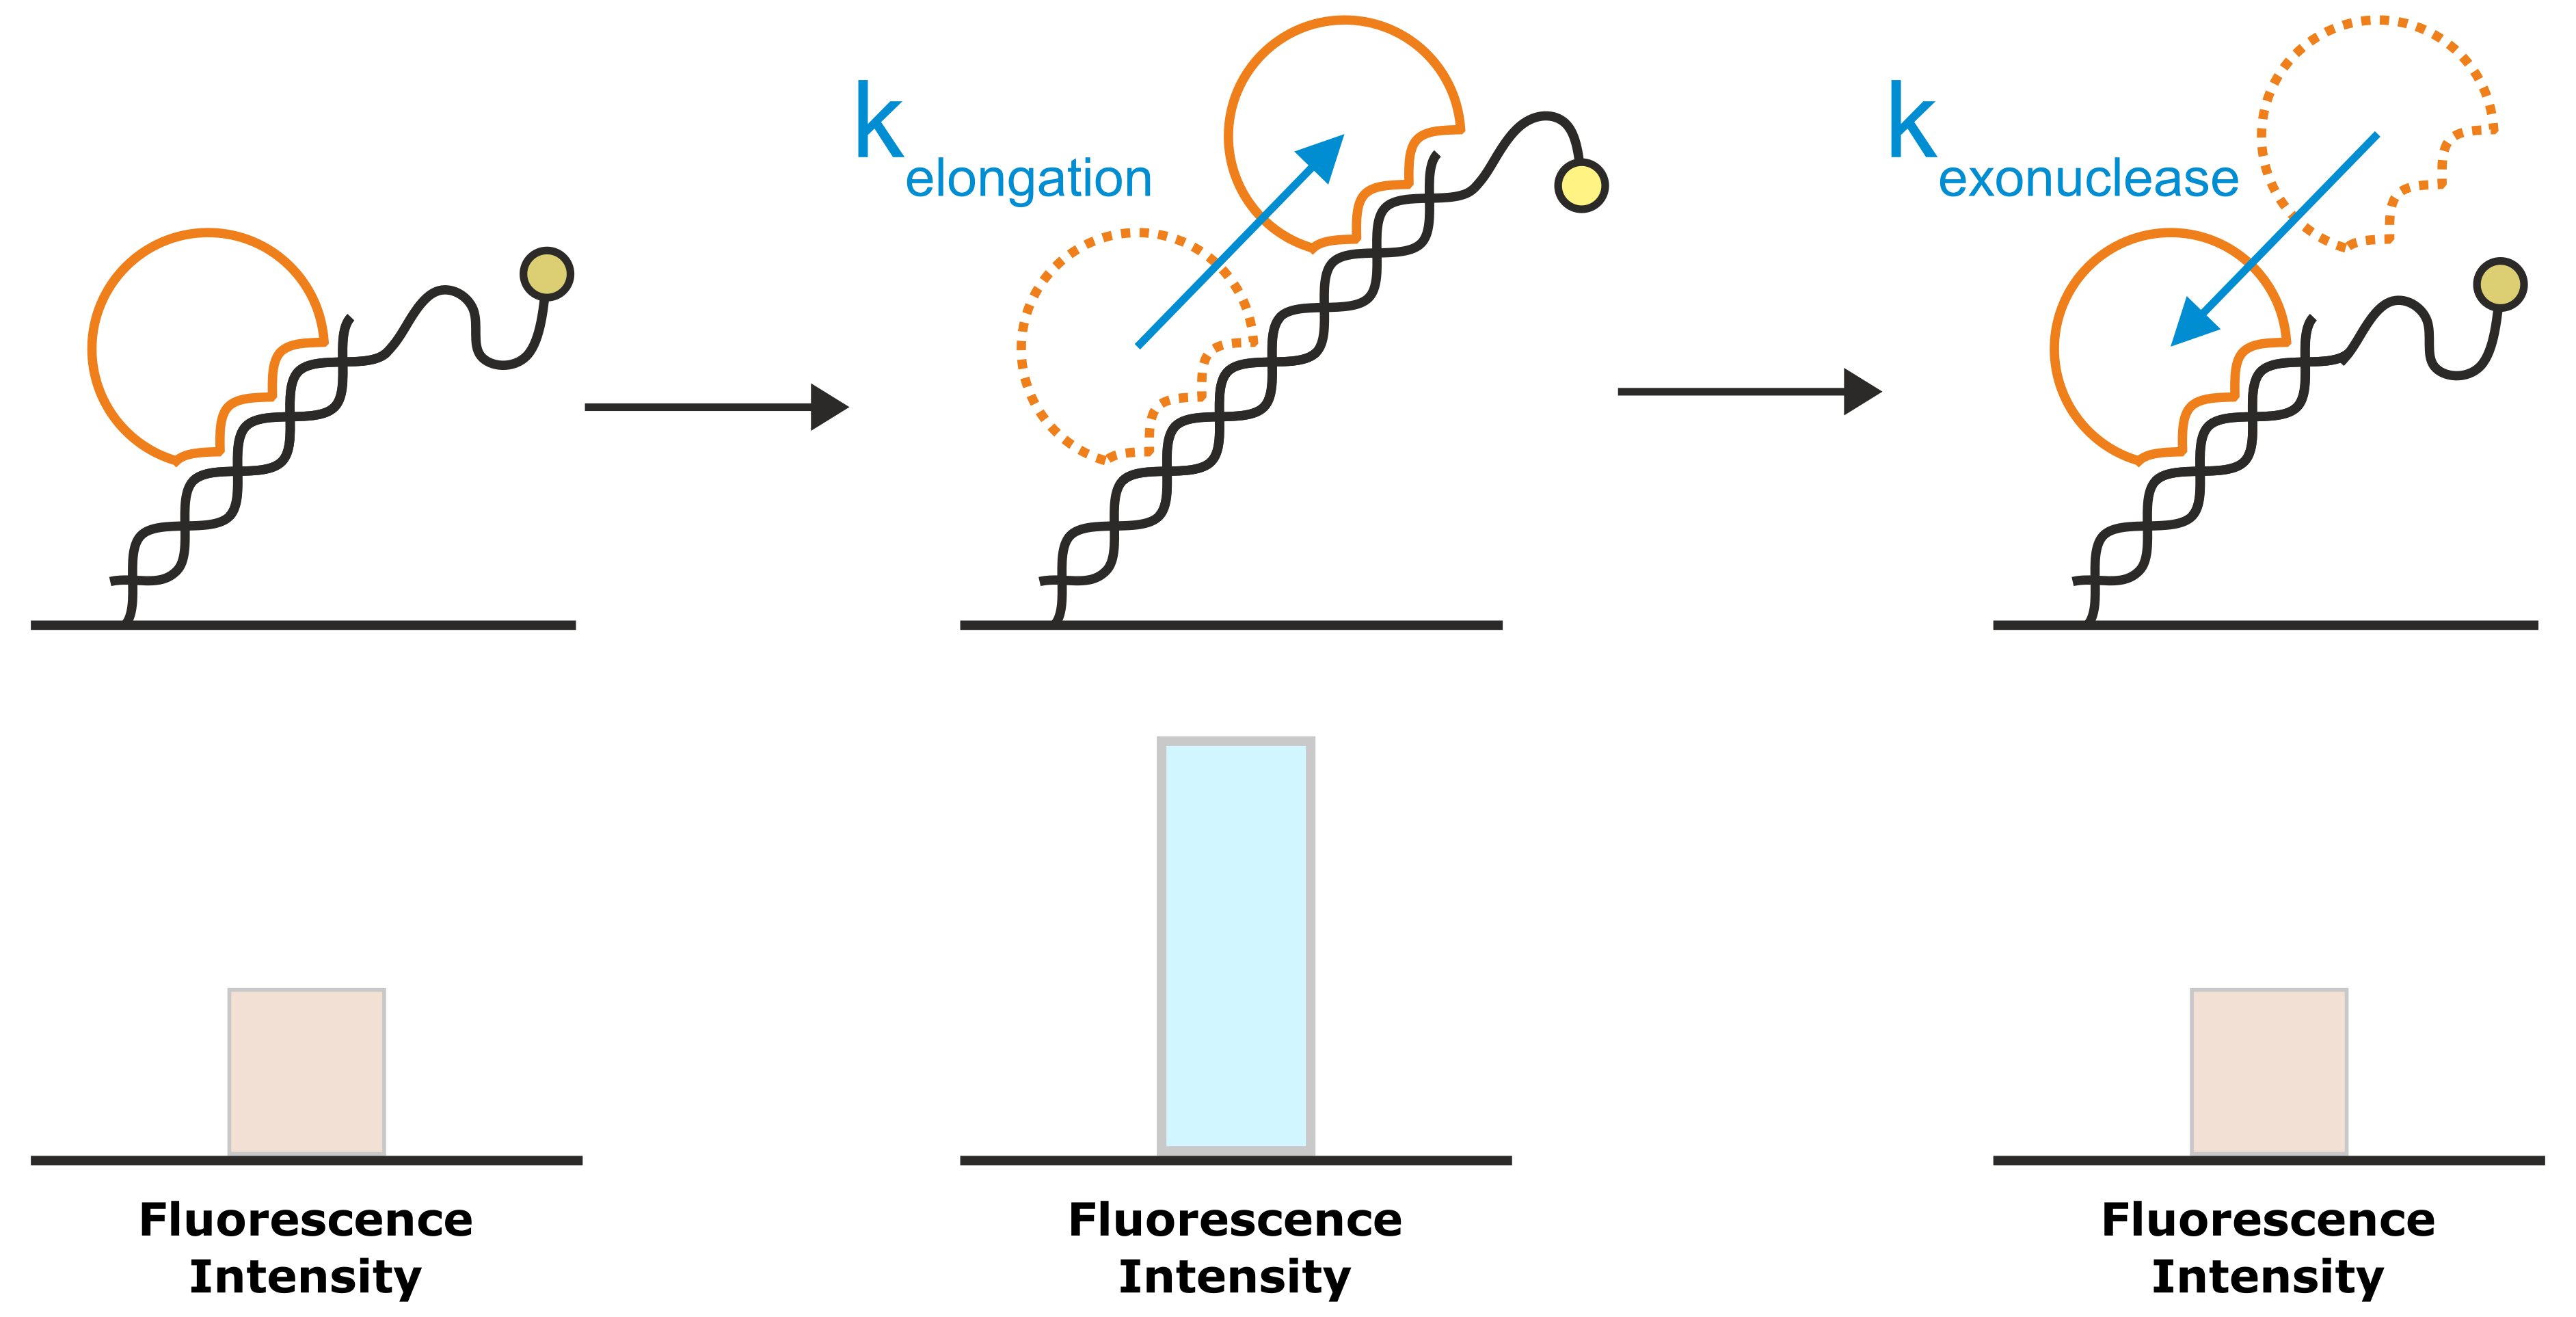
Figure 8: A very common application of the Molecular Ruler principle is the investigation of DNA elongation kinetics by polymerases. The template for the DNA elongation is a double-stranded DNA nanolever that is modified with a single-stranded overhang. In the initial state, the partly single-stranded nanolevers exhibit a relatively low fluorescence intensity, owing to their high flexibility that allows them to approach the quenching gold surface. Once a polymerase starts to elongate the DNA, the single-stranded DNA overhang is converted into a rigid double-helix. The transition from the flexible single-strand DNA into the rigid double-strand moves the average position of the fluorophore further away from the gold surface, which results in an enhanced fluorescence intensity. For enzymes with exonuclease activity, the reverse approach yields a decrease in fluorescence intensity.
Please see section “What are the signals that can be derived from switchSENSE® experiments?”.
The Lollipop model is a biophysical model used in DRX instruments to provide an estimated size of the protein of interest in form of the hydrodynamic diameter. The model assumes that the DNA nanolevers are a charged and rigid cylinder and the attached protein molecules are a spherical body on top of the cylinder. Data obtained in a dynamic mode measurement are compared with a library of simulated data. A detailed mathematical description is published and can be found here. The application of the lollipop model for protein sizing is limited since it highly depends on e.g. the buffer and the nanolever size. That is why we do not apply it in our new heliX® product line.
The hydrodynamic diameter (Dh) of a molecule is defined as the diameter of a perfect solid sphere that would exhibit the same hydrodynamic friction as the molecule of interest. Thus, the Dh value reflects primarily the hydrodynamic friction but is usually also a good estimation of the absolute size of the molecule. Generally, the more globular the shape of a molecule is, the better the Dh value reflects the actual diameter.
The Dynamic Response (DR) is a parameter that characterizes the switching speed of DNA nanolevers. It is automatically calculated from the raw data by the switchSENSE® software package. For every recorded data point, the software evaluates typically the upward motion of the DNA nanolevers as indicated in Figure 9. Integration of the normalized time-resolved fluorescence intensity traces that reflect the upward motion, yields the Dynamic Response value for a certain time interval. Changes of the hydrodynamic friction, such as the interaction with an analyte molecule, will affect the progression of the fluorescence intensity curve, reflecting the altered switching dynamics. As indicated in Figure 9, such an event will yield a different integrated area (=DR) under the fluorescence intensity curve, compared to the initial state. Generally, small DR values can be attributed to slow switching motion and large values indicate fast switching.

Figure 9: The Dynamic Response is calculated by integration from normalized fluorescence intensity data, typically of the upward motion of the DNA nanolevers. Events, such as the binding of an analyte, which change the hydrodynamic friction, affect the steepness and shape of the normalized fluorescence intensity progression, resulting in a different Dynamic Response level.
Depending on the interaction to be investigated, it is advisable to select different integration time intervals for optimal signal to noise ratio. Hence, the Dynamic Response is provided for several integration intervals. For the respective interval, the time at which the potential is reversed from an attractive (positive) to a repulsive (negative) potential, is defined as 0 .
Additional parameter of the Dynamic Response is the Dynamic Response downward (DRdown), which is used to characterize the downward motion of the DNA nanolevers. Corresponding to the upward motion of the DNA nanolevers, also their downward motion is affected by changes in the hydrodynamic drag resulting in high DR levels for fast switching, and low levels for slow switching.
Instrument and Chip Handling
The easiest way to check if your flow channel is suitable for the planned experiment, is to perform a status check of the desired flow channel.
For further reading please see “What is a chip status test and how should I interpret it?”.
Chip regeneration implies that all ligand molecules immobilized on switchSENSE® electrodes in one flow channel and all potentially bound analyte molecules are completely washed off the sensor surfaces by treatment with a regeneration solution. This leaves single-stranded DNA nanolevers on the sensor electrodes, which can be re-functionalized with fresh ligand molecules by hybridization to the corresponding complementary DNA nanolevers.
The regeneration process contains two crucial steps: the denaturation of the double-stranded DNA nanolevers, leaving single-stranded DNA molecules on the electrodes and successively, the hybridization during which double-stranded nanolevers are formed again. The hybridization of the DNA nanolevers is usually monitored during a switchSENSE® experiment. Figure 10 shows typical fluorescence intensity traces corresponding to the transition of single stranded DNA nanolevers to double stranded DNA nanolevers. The basic effect that allows to observe DNA hybridization on a switchSENSE® sensor electrode is that single-stranded DNA nanolevers and double-stranded DNA nanolevers exhibit remarkably different switching properties. Due to its high flexibility, single stranded DNA can only be switched within the area above the electrode that is subjected to electric field, which extends to only a few nanometers into the electrolyte solution. In contrast to this, double stranded DNA is very rigid, with the consequence that during the repulsive switching phase, parts of the DNA nanolever that are exposed to the electric field push the major part of the nanolever far beyond the electrically affected areas. As stated previously under the Molecular Ruler principle, this translates to an increase in repulsive fluorescence intensity (Fup) and in switching amplitude, which is defined as the difference between the repulsive and attractive fluorescence intensity (ΔF).
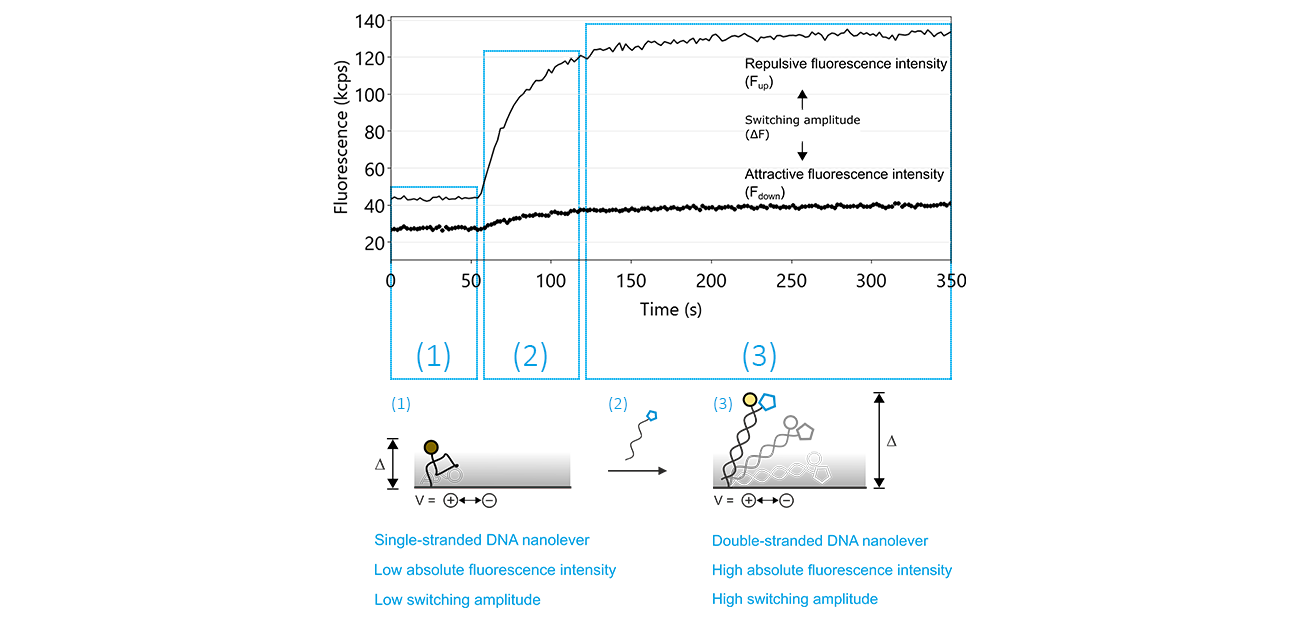
Figure 10: The denaturation of double-stranded DNA nanolevers using a regeneration solution with a basic pH value followed by re-hybridization, yielding double-stranded DNA nanolevers, are the two key features that facilitate the unique regeneration process of switchSENSE® electrodes. After denaturation, which is not recorded by the sensor system, the switching process can be monitored by observing the attractive (Fdown; dotted line) and repulsive (Fup; solid line) fluorescence intensity values. As long as the DNA nanolevers remain in the single-stranded state, the Fup is comparably low, with a reduced switching amplitude (ΔF). The hybridization of the complementary DNA is marked by a significant increase of Fup and therefore of ΔF.
Denaturation of the DNA nanolevers:
The denaturation of the double-stranded DNA nanolevers is automatically carried out by the DRX instrument by treatment of the sensor surfaces with the basic Regeneration Solution, leaving single-stranded DNA on the sensor electrodes. In case this step is not successful, the DNA nanolevers on the sensor electrodes remain double stranded, which prevents hybridization of fresh DNA-ligand conjugates. Figure 11 shows an exemplary data set of a switchSENSE® hybridization routine, during which the denaturation step was not successful. The reason for absence of denaturation or incomplete denaturation is usually shortage of regeneration solution or inactive regeneration solution. The latter is sometimes observed when the regeneration solution was stored in contact with air for an extended timescale.
How do I recognize insufficient denaturation?
- Check the absolute fluorescence intensity at the beginning of the regeneration trace. On successful denaturation, the fluorescence intensity is comparably low (Fup ~ 10 – 50 kcps). If the baseline of the hybridization trace (up to about 50 s after start of the measurement) is significantly higher, this denotes that the DNA nanolevers are still double-stranded.

Figure 11: Fup (solid line) and Fdown (dotted line) traces of a hybridization routine after insufficient denaturation of the DNA nanolevers. It is clearly visible that Fup constantly remains at a high intensity level during the entire process, which indicates that there is no transition from single-stranded to double-stranded DNA nanolevers. In grey, the respective hybridization traces on successful denaturation are shown for comparison.
Hybridization of the DNA nanolevers:
After denaturation of the DNA nanolevers, the single-stranded DNA molecules on the sensor electrodes are re-hybridized to double-stranded DNA nanolevers by incubation with the respective complementary DNA molecules. This is a crucial step for switchSENSE® experiments, as it facilitates the immobilization of ligand molecules. Given that the denaturation step was successful, problems with the hybridization step are usually either caused by shortage of DNA solution or by incubation with non-complementary DNA molecules. Furthermore, the use of an insufficient concentration of complementary DNA will result in partial DNA nanolever hybridization. Figure 12 shows fluorescence intensity traces of three independent regeneration routines, which exhibit no or partial DNA nanolever hybridization.
How do I recognize insufficient hybridization?
- Does the fluorescence intensity increase during the hybridization? The hybridization of the complementary DNA is accompanied by a significant increase of the repulsive fluorescence intensity (Fup), caused by the transition of the immobilized DNA molecules from single-stranded to double-stranded state. On successful hybridization with bare complementary DNA, the Fup intensity should at least increase by 100 %.
- Is there a switching amplitude, i.e. is there a significant difference between Fup and Fdown? Even in single-stranded state, switching DNA nanolevers exhibit ΔF values of about 10-20 kcps. If there is no significant difference between Fup and Fdown, this points to the presence of air in the flow channel, which is usually the consequence of an empty autosampler vial.
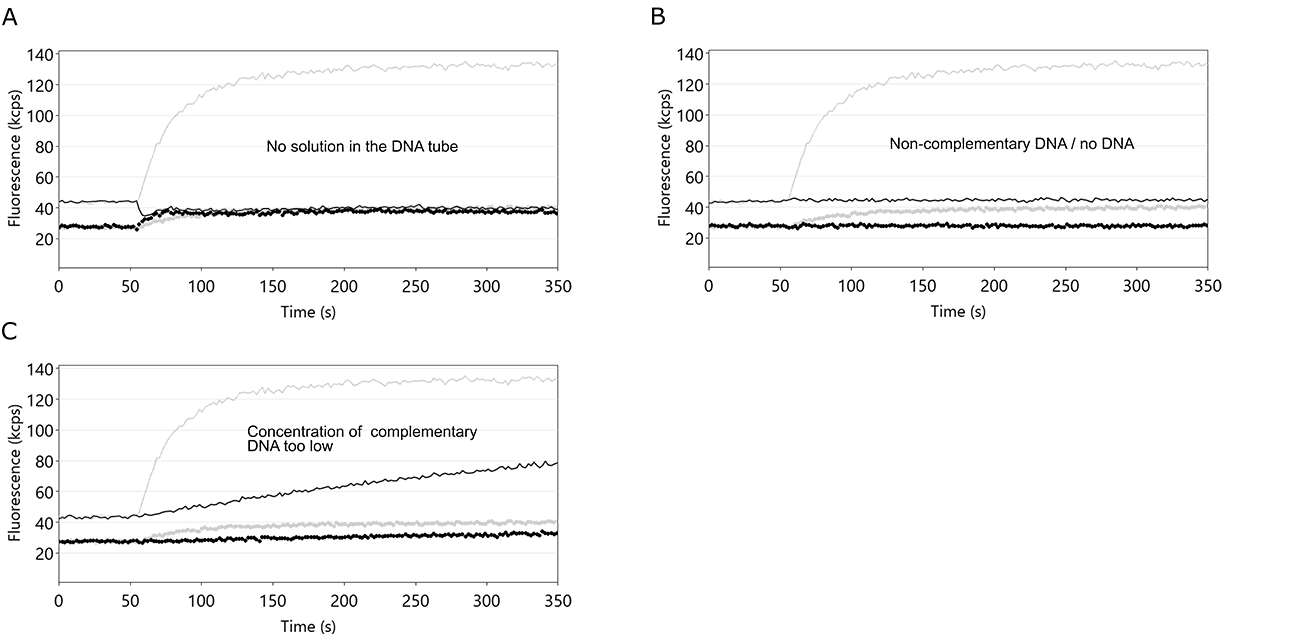
Figure 12: Fluorescence intensity profiles of switchSENSE® hybridization routines. In each example, the hybridization of the DNA nanolevers was hindered by the stated cause. A: an empty DNA vial. If the volume of the complementary DNA solution is not sufficient, air is injected into the flow channel, which immediately ceases the DNA switching motion. Fup and Fdown now show identical values. B: use of non-complementary DNA or no DNA. In both cases, the single-stranded DNA nanolevers on the switchSENSE electrodes cannot hybridize to their complementary DNA and thus remain single-stranded. In this case, Fup and Fdown remain constant. C: concentration of the applied DNA solution is too low. Corresponding to other association kinetics, the hybridization of DNA nanolevers is affected by the concentration of complementary DNA. If the concentration of complementary DNA is too low, the hybridization process is not completed within the time-scale chosen by the switchBUILD software and neither Fup, nor ΔF reach a constant final level. Grey lines depict the case of ideal DNA nanolever hybridization.
What can I do to improve the hybridization efficiency?
Typically, the concentrations of complementary DNA solutions and the corresponding hybridization times suggested by the switchBUILD software are optimized to ensure surface saturation by hybridization. Yet, in some cases, ligand molecules conjugated to the complementary DNA strand can interfere with the hybridization and thus reduce the hybridization speed. In these situations, the hybridization efficiency can be increased with the following measures:
- Increase the concentration of complementary DNA. This is a simple but efficient way to increase the hybridization speed, which scales linearly with the concentration of complementary DNA.
- Increase the hybridization temperature. Elevated temperatures generally accelerate the hybridization velocity as is the case for most biochemical reactions. Secondly, nucleic acid ligands (overhangs) that are attached to the complementary DNA can form secondary structures that hinder the formation of the double-stranded DNA nanolevers. These secondary structures can often be de-stabilized by working at higher temperatures. To perform your hybridizations at temperatures above 25 °C, activate the expert mode of switchBUILD. The desired hybridization temperature can then be adjusted in the respective experimental element. Please ensure that the ligand molecules of interest are stable at the chosen elevated hybridization temperature.
- Reduce the salt concentration of DNA conjugate solution: Similar to increased hybridization temperatures, also a reduction of salt concentration in the hybridization solution simultaneously accelerates the general DNA hybridization process and also destabilizes secondary structures of nucleic acid ligands. Please make sure to choose conditions that correspond to at least 10 mM of total monovalent salt concentration to ensure sufficient shielding of the negatively charged DNA backbone.
Briefly, the answer is yes. Decrease in the absolute fluorescence intensity is completely normal during switchSENSE® experiments. There are several factors that can affect the fluorescence emission, for instance photobleaching, chemical and thermal stress on the fluorophore, loss of DNA from the sensor surface or quenching of the fluorophore by a hybridized protein conjugate. So, do not worry about loss of fluorescence intensity between regeneration steps. When you observe an increase in the repulsive fluorescence intensity (Fup) during the respective hybridization, the sensor electrodes are successfully functionalized.
For further reading, please also refer to “What is a chip regeneration? How do I know, if my chip regeneration was successful?”.
switchSENSE® chips are very versatile, typically long-lasting and can be used for a multitude of different experiments, due to the possibility of chip regeneration. During the course of the experiments, the sensor electrodes are subjected to a certain decrease of fluorescence intensity which limits their lifespan. Furthermore, potentially harmful experimental conditions, such as high temperatures, organic solvents or extreme pH values, can negatively affect the chip viability. To ensure ideal conditions for your experiment, it is thus important to assess the quality of the sensor electrodes prior to an experiment. This is particularly advisable when a flow channel has been in use for several experimental runs. Please note that for a chip status measurement the DNA nanolevers must be in double-stranded state without attached ligand molecules. If this is not the case or if you are not sure about the state of the DNA nanolevers, please select “with regeneration” in the chip status dialog.
The chip status test is a tool that quickly provides information on the quality of all electrodes of a selected flow channel under standard conditions. After a few minutes, the tested electrodes are ranked in three categories:
- Red: Bad electrode viability. Do not use this electrode anymore!
- Yellow: Moderate electrode viability. This electrode can still be used but should be avoided for very long experiments or experiments performed under harsh conditions.
- Green: Good electrode viability.
As the lifetime of an electrode is affected by different factors, these rankings can only provide guidance for planning of your experiment. Thus, in addition to the chip status test you should always consider the following aspects:
- Under mild conditions, electrodes ranked as moderate can still be used for many experiments, including several regeneration steps.
- Electrodes used for experiments performed at a very low surface density, typically are ranked as moderate or even bad. This is expected but certainly limits the number of experiments that can be performed on such an electrode. We advise to use a fresh electrode for every low-density experiment.
- Although all electrodes inside one flow channel are exposed to identical chemical and thermal conditions, electrodes that are not actively used during experiments (i.e. not continuously illuminated) usually show a significantly less pronounced loss in fluorescence intensity.
- If you’d like to perform your experiment under harsh conditions, we advise to test these conditions under the experimental preferences that you intend to use (binding times, temperature, number of regenerations) using only one electrode of the flow channel.
switchSENSE® chips are generally robust and long-lasting, if handled and stored under recommended conditions.
Instructions for chip storage:
- Store the chip at 4 °C in its original packing, whenever it is not used for experiments.
- Do not freeze a switchSENSE® chip!
- To increase the chip life time, the DNA nanolevers should be stored in double-stranded form without attached ligand molecules. Thus, in switchBUILD add the standby routine with regeneration step at the end of your measurement. This ensures that the DNA nanolevers are hybridized with their complementary strands prior to ejecting the chip.
- The flow channels should be as dry as possible. When the chip is ejected from the DRX instrument, the used flow channels are vented with air for drying. Nevertheless, small droplets of buffer can remain in the flow channel. Therefore, it is advisable to manually purge the used flow channel with compressed gas (dust remover, nitrogen line).
- For short term storage (e.g. after an overnight measurement), the chip can remain inside the DRX instrument. Ensure to add a standby step at the end of the assay, which will purge the flow channels with air.
Instructions for chip handling:
- Always wear gloves when handling a chip to avoid contamination of the flow channels and finger prints on the glass surface.
- The chip is best handled using vacuum tweezers. Please be aware that vacuum tweezers can release the chip unexpectedly. The drop might result in damage to the chip. So please make sure to position your other hand below the chip.
- Please avoid touching the contact pads (golden squares) used for electric connection of the sensor electrodes as this might damage the DNA layers on the electrodes.
- When inserting the chip into the chip holder, make sure that the chip is in the correct orientation. This is the case, if you can read the “Dynamic Biosensors” logo on the chip.
- After extensive experiments, it is possible that the chip cannot be lifted at ease from the chip holder using vacuum tweezers. In such a situation, carefully loosen the chip by lifting it at one of the corner indentations using a clean pipette tip. Afterwards, the chip can easily be lifted with vacuum tweezers.
In rare cases, it is possible that a leak occurs in the DRX chip holder. This will not cause damage to the DRX sensor system as all ongoing measurements and fluidic steps will automatically be stopped by the switchCONTROL software. In the event of a leak during a measurement, a clear notification will pop-up in the switchCONTROL window. By following the instructions below, your DRX system will be operational again within a few minutes:
- In the switchCONTROL software: Go to „Chip“
- Select „Eject Chip Holder” and mark the flow channels that were used
- Click “Ok”
- Remove chip. As there might be liquid below the chip, the chip may adhere to the chip holder. Thus, more effort than usual might be required to remove the chip. In this case, you can carefully lift up the chip with a clean pipette tip.
- Dry the chip holder with lint-free tissues
- The liquid handling system of the DRX instrument will be re-activated only, if the leak detectors are completely dry. So, please make sure to thoroughly dry the leak detectors, which are located in the corners of the chip holder facing away from you. Purging these with compressed air or nitrogen gas is usually very efficient. Furthermore, the drying process can be accelerated by heating of the open chip holder to 50 °C for about 5 minutes. To do so, please use the manual chip temperature control function of switchCONTROL.
Both the Start and the Prime routines are default liquid handling procedures that are used to purge the DRX instrument with running buffers of interest.
The Start routine should always be performed after a Clean&Sleep routine. In this thorough purging program, the complete fluidic system, including all flow channels of the chip holder (cleaning chip is required), is rinsed with buffer to remove potential residues of the cleaning solution used previously during the Clean&Sleep routine. To run this routine, click “Fluidics”, then “Start” and follow the instructions on the screen.
The Prime routine removes all buffers from the fluidic system and refills all microtubing with fresh buffer. It is typically used between experiments to exchange the running buffer. In this case, the complete liquid handling, except for the flow channels of the chip holder, are purged. Thus, the biochip can remain inserted as buffer is not injected into the flow channels. Furthermore, the prime routine can be used to remove air from the fluidic system, for instance when the volume of buffer needed for an experiment was underestimated. To run this routine, click “Fluidics”, then “Prime” and follow the instructions on the screen.
After using a flow channel on a switchSENSE® chip (i.e. after any type of liquid has entered the flow channel), it must be vented before it can be removed from the chip holder.
This is easiest done during the chip ejection procedure:
- Go to „Chip“
- Select „Eject Chip Holder” and mark the flow channels that were used
- Click “Ok”
In some cases, you might want to vent a flow channel that was used but continue experiments on another flow channel without the need to eject the chip holder. This can be done with the following switchCONTROL functions:
- Go to “Fluidics”
- Select “Maintenance”
- Select “Vent channels” to select a specific channel
The selected microfluidic channels will be purged with air.
All DRX instruments can be equipped with different autosampler adaptors (standard tray, 96-well plate tray).
To change the autosampler tray, please refer to the DRX manual or contact the Dynamic Biosensors support team at support@dynamic-biosensors.com.
After exchange of the autosampler tray, it is mandatory to adjust switchCONTROL and switchBUILD accordingly:
switchCONTROL:
- Go to “File”
- Select “Options” and “Autosampler”
- Select the correct format
- Restart with switchCONTROL
switchBUILD:
- Go to “Settings”
- Select “Autosampler”
- Select to correct format
- Eject the chip holder (without channel venting) and check if the chip was placed correctly in the chip holder. The chip was inserted correctly if you can easily read the “Dynamic Biosensors” label.
- Make sure to close the chip holder properly. This is the case, if you hear two clicks caused by the locking mechanism.
- Retract the chip holder again and check if alignment works.
During alignment, check if you can see the alignment crosses in the electrode display located in the upper left corner of the switchCONTROL window. If this panel stays constantly black during alignment, there might be a connection problem between computer and DRX instrument. In such a case, follow the re-start instructions:
- Close the switchCONTROL software
- Turn off computer
- Shut down the DRX instrument
- Wait for about 30 seconds
- Turn the instrument back on
- Start computer and open the switchCONTROL software
- Go to “Chip”
- Select “Align”
In case the chip alignment is still not successful after following these instructions, please contact the Dynamic Biosensors support team at support@dynamic-biosensors.com
You can only observe an experiment in one flow channel at a time. Nevertheless, you can run subsequent experiments in all the channels: consecutive experiments can be set up for the different channels in the switchBUILD software by inserting a “new channel” element into the taskflow. The DRX will automatically use the flow channels in the preset order.
switchANALYSIS Software
To change font size and line thickness of graphs exported via the image export or snapshot option, please proceed as follows:
- Go to „Settings“
- Then select „Export“
You can easily combine two independent switchANALYSIS files using the “Append” function:
- Open one of the projects
- Go to “File”
- Select “Append”, then choose the file to be attached.
switchBUILD Software
There are two basic approaches to detect a conformational change:
- The first approach is to include a sizing measurement into a kinetic. This way, the association and dissociation kinetics of the test compound to the ligand molecule will be recorded and at equilibrium (in between association and dissociation) a sizing or stopped flow experiment will be performed. This approach is particularly suitable, if you are also interested in the kinetic rate constants and the affinity constant of the interaction between test compound and ligand.
- The second approach utilizes the sizing tool for His6-tagged proteins in switchBUILD. In this case, the His6-tagged ligand molecule is pre-incubated with the compounds to be tested, immobilized on the switchSENSE® chip and a sizing experiment is performed. Especially when testing very weakly binding compounds (e.g. fragments), this strategy is advisable as very long pre-incubation times can be chosen.
The switchBUILD kinetic tool helps to easily set up an optimized taskflow to analyze the interaction of interest and automatically suggests concentration ranges and measurement times based on the estimated affinity of the interaction partners.
When no affinity constants are known, an educated guess of the affinity range helps to set up your assay. This can be done, for instance by choosing an interaction with a comparable molecule class (e.g. antibody) from the provided drop-down list. Based on this estimate, an affinity scouting can be carried out. To do so, choose a high dilution factor (at least 3x) and at least three concentration steps to cover a possibly wide concentration range. This way, it is usually possible to roughly determine the affinity range which can be narrowed down in further experiments.
For kinetic experiments, choosing the appropriate flow rate can be a crucial factor for determining the correct affinity. This can possibly lead to measurement artifacts that are caused by insufficient flow rates. During the association phase, a too slow flow rate can be the cause for mass transport limitation effects. On the other hand, during the dissociation phase an inadequate flow rate can result in re-binding effects. Both these effects should be avoided to obtain high quality kinetic data. Thus, the general rule is to work at a comparably high flow rates (e.g. > 100 µl/min) whenever the experimental circumstances allow. However, there are certain limitations to this, as sample and buffer amounts are often of limited availability.
Specific Experimental Considerations
As the DNA switching process is extremely sensitive to changes in the hydrodynamic drag, minor changes in the molecular structure of proteins and other macromolecules can be detected as changes in the switching dynamics. A typical application of such an experiment, is the detection of ligand-induced conformational changes, for example upon association of a small molecule to a protein.For the successful detection of a conformational change, please consider the following aspects:
- The molecule of interest can be captured via hybridization after covalent coupling, or via a tag system
(His6-Tag, Strep-Tag, biotin-streptavidin interaction, etc.) - Significant conformational changes can be resolved as changes of a protein’s hydrodynamic diameter, which is calculated using the Lollipop model. Please note that this kind of analysis is only available when using appropriate buffer conditions.
Also see “What is the Lollipop Model?” - Please analyze changes in the hydrodynamic diameter using the “Sizing” evaluation tool in switchANALYSIS.
- Often, conformational changes affect only minor portions of the protein molecule, which might not be resolvable by use of the Lollipop model.
- Nevertheless, these changes usually still change the hydrodynamic properties of the protein, resulting in changes in the switching speed.
- These changes can be evaluated as relative Dynamic Response change in comparison to the bare DNA reference measurement.
- For such analyses, please use the “Conformational Change” evaluation tool in switchANALYSIS.
- It is advisable to use a detergent-free running buffer (e.g. PE40 without Tween-20).
- Liposomes can be immobilized on the biosurface using a cholesterol-ligand, i.e. cholesterol modified DNA nanolever
(cholesterol intercalates into lipid bilayer). - Use low flow rates for association and dissociation (e.g. < 50 µl/min) to prevent destabilization of membranes.
- Commonly used liposome concentration for sufficient surface coverage: 300 µl of a 0.2 mM solution (phospholipid concentration)
In some cases, experiments with peptides can be challenging due to the chemical properties of the individual peptides. Major aspects that can negatively affect your experiments and suggested solutions for troubleshooting are listed below:
Peptide solubility:
A frequent problem in such experiments is the low solubility in water of some peptides. This can be improved by addition of a compatible organic solvent to both the running and the sample buffer used in your switchSENSE® experiment. A commonly used solvent is dimethyl sulfoxide (DMSO) which may be supplemented to the experimental buffer up to 5 % v/v.
Peptide charge:
If a peptide contains charged amino acids, it is likely to exhibit a large mass to charge ratio which can prove to be problematic, especially when working with charged surfaces. The consequences range from extensive unspecific surface adsorption to the absence of specific binding due to electrostatic repulsion. If you observe such a behavior, try to increase to salt concentration of your running and sample buffer. This will increase the shielding of the charges of the peptide molecule.
As it is based on surface-immobilized DNA nanolevers, the switchSENSE® technology is particularly suitable to investigate interactions between proteins and nucleic acids. There are two basic experimental setups that are commonly used to investigate protein/nucleic acids interaction using switchSENSE®:
- Experiments with proteins that target either double-stranded or single-stranded DNA in an unspecific manner (i.e. independent of the DNA sequence), can be easily performed with standard switchSENSE® chips. To achieve sensor electrodes functionalized with double-stranded DNA nanolevers, simply use unmodified complementary DNA as ligand molecule. For experiments with single-stranded DNA, just use X40 buffer as ligand solution.
- To analyze binding to a specific DNA/RNA sequence, a custom sequence can be attached as an overhang to the complementary DNA sequence of the surface tethered ssDNA oligo. The overhang may either be double-stranded or single-stranded. When working with these overhang constructs, it is best to choose a switchSENSE® biochip with 48bp nanolevers. For questions regarding your sequence design, please contact the DBS support team at support@dynamic-biosensors.com
Protein/nucleic acid interactions generally show an extensive variety of different binding modes that facilitate the interaction.
Due to this complexity, sometimes thorough assay optimization is required to characterize the interaction.
Following, the most common optimization parameters are listed:
- Ionic strength: Many protein/DNA interactions are of ionic nature or ionic forces are required to initiate the interaction. As ionic forces are highly affected by the ionic strength of the buffer solution, the affinity of the interaction might drastically differ for different buffer solutions. At the extreme, this could imply the complete absence of interaction, if the ionic strength is too high, or completely non-specific binding, if the ionic strength is too low.
- pH: Furthermore, ionic forces heavily depend on the charge of the protein of interest. In turn, the protein charge depends on the pH of the experimental buffer solution. Thus, also the pH of the used buffer solution can affect the affinity in a comparable way as the ionic strength.
- Background affinity: Many nucleic acid binding molecules exhibit a certain background affinity to any type of nucleic acid. To differentiate this background affinity from sequence-specific binding, it is crucial to run experiments with a randomized control sequence, preferentially with equivalent base composition. Usually, the background affinity is weaker than the specific interaction, with the consequence that non-specific binding only occurs at comparably high concentrations. In many cases, background affinity can be completely abolished by optimization of ionic strength and/or pH of the buffer solution. If this does not prove successful, the addition of non-specific competitor substances (e.g. fragmented salmon sperm DNA or polydIdC) or other additives (glycerol, heparin) is often highly effective in reducing background affinity.
switchSENSE® measurements can be performed from 8 to 70°C at constant temperatures.
Additionally, the temperature of the biochip can be ramped up or down (1-10°C/min), e.g. during a melting experiment.
Be aware that the chip life time may suffer from long experiments at elevated temperatures and by repeated heat/cool cycles.
Generally, switchSENSE® can tolerate measurements in a variety of complex matrices, including cell lysates and high serum concentrations up to 80%. Notably, the robust fluidic system, which DRX instruments are equipped with, allows to handle rather complex solutions.
Nevertheless, measurements in complex media usually require a certain degree of assay development. In most cases, this is owed to the occurrence of unspecific adsorption to surfaces of the sensor system.
For successful experiments, please consider the following aspects:
- Always filter samples or remove solid components by centrifugation prior to injection.
- The addition of non-specific competitor substances (fragmented salmon sperm DNA, polydIdC) is usually required to reduce background affinity.
- When using salmon sperm DNA or similar reagents, make sure to use a well buffered solution to avoid acidification.
- Measurements in static mode are usually more robust when complex media are tested.
- The activity of nucleases that are potentially present in the test solution, is often reduced by EDTA.
- Always perform a reference injection on DNA nanolevers without ligand.
- As complex media usually differ significantly in composition, usually the ideal dilution of the original sample must be optimized.